07Nov

Eaton Corp PLC Stocks Elliott Wave Technical Analysis: ETN Currently in an Impulsive Uptrend, Investors Can Gauge Upcoming Opportunities

ETN Elliott Wave Analysis: Current Trend Overview

This analysis delves into the trend structure of Eaton Corp PLC (ETN), applying the Elliott Wave Theory on both daily and 1-hour charts. The breakdown below provides insight into ETN's positioning and likely price trajectory.

ETN Elliott Wave Analysis - Daily Chart Overview

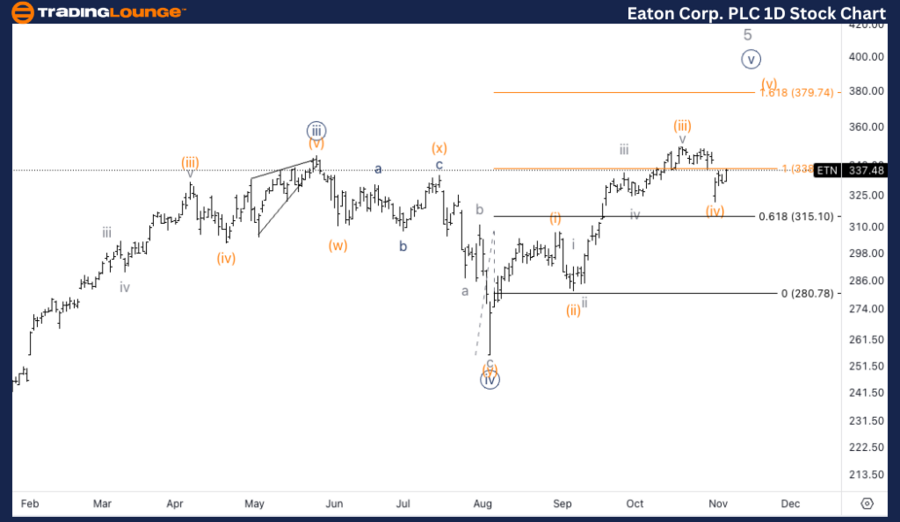
Eaton Corp PLC (ETN) - Daily Chart Analysis

ETN Elliott Wave Technical Analysis

Trend Function: Uptrend

Wave Mode: Impulsive

Structure: Motive Wave

Position: Minor

Current Direction: Ascending within wave (v) of 5

We anticipate one additional upward move in wave (v) of {v} of 5, marking the potential end of a larger upward cycle. The projected resistance level, MG2, around $380, may signal a point of reversal or consolidation.

Detailed Daily Chart Analysis for ETN

The daily analysis reveals that Eaton Corp (ETN) is approaching the final phase of Minor wave 5, now progressing in wave (v) of {v}. This implies that at least one more upswing is expected before completing the overall uptrend. The resistance level at MG2, near $380, could serve as a potential top before a more significant corrective phase begins.

Eaton-Corp-PLC-1D-St...


ETN Elliott Wave Analysis - 1-Hour Chart Overview

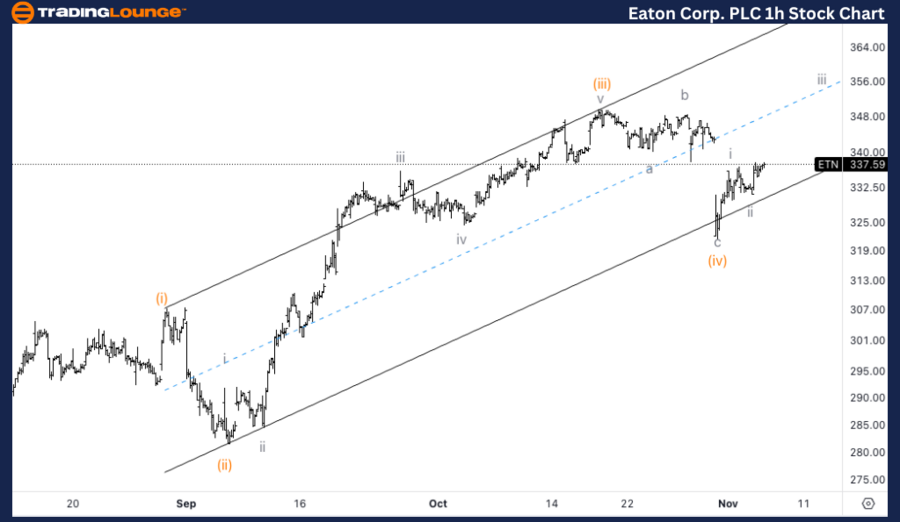
Eaton Corp PLC (ETN) - 1H Chart Analysis

ETN Elliott Wave Technical Summary

Trend Function: Uptrend

Wave Mode: Impulsive

Structure: Motive Wave

Position: Wave iii of (v)

Current Direction: Ascending in wave (v)

A three-wave corrective pattern in wave (iv) has found support at the upper boundary of the parallel trend channel. With ETN trading above the MG1 level, the next upside target appears to be $350 as wave (v) extends further.

Detailed 1-Hour Chart Analysis for ETN

The 1-hour analysis shows ETN completing wave iii of (v), with the price currently moving through wave (iv). This wave has formed a three-wave correction pattern, finding support along a parallel trend line. Should the price maintain its position above Trading Level MG1, the subsequent target on the upside is $350, as wave (v) seeks to advance further.

Technical Analyst: Alessio Barretta

Source: visit Tradinglounge.com and learn From the Experts Join TradingLounge Here 

See Previous: Netflix Inc. (NFLX) Elliott Wave Technical Analysis

VALUE Offer - Buy 1 Month & Get 3 Months!Click here

Access 7 Analysts Over 200 Markets Covered. Chat Room With Support

Eaton-Corp-PLC-1h-St...

Related

Successful forex trading with expert insights: Australian Dollar/U.S.Dollar (AUDUSD) Elliott Wave Technical Analysis

Successful forex trading with expert insights: Australian Dollar/U.S.Dollar (AUDUSD) Elliott Wave Technical Analysis

Discover the latest AUDUSD Elliott Wave analysis for March 12, 2024, providing comprehensive insight...

Read More >
Insights into BTCUSD price prediction and trading strategies: Bitcoin Crypto Price News Today Elliott Wave Technical Analysis

Insights into BTCUSD price prediction and trading strategies: Bitcoin Crypto Price News Today Elliott Wave Technical Analysis

This article provides an in-depth BTCUSD Elliott Wave analysis, offering insights into Bitcoin price...

Read More >
Mahindra & Mahindra Stock Elliott Wave Analysis Shows Bullish Trend and Strong Forecast with Wave 5 Now in Progress

Mahindra & Mahindra Stock Elliott Wave Analysis Shows Bullish Trend and Strong Forecast with Wave 5 Now in Progress

Elliott Wave analysis of Mahindra & Mahindra, highlighting a strong bullish trend supported by impul...

Read More >
Bitcoin Elliott Wave Technical Analysis: BTCUSD Charts, Trading Strategy, Bullish Momentum, and Price Prediction

Bitcoin Elliott Wave Technical Analysis: BTCUSD Charts, Trading Strategy, Bullish Momentum, and Price Prediction

Bitcoin Elliott Wave Analysis highlights BTCUSD technical charts for both daily and 4-hour timeframe...

Read More >
USDJPY Elliott Wave Analysis: Counter-Trend Corrective Mode Revealed on Day Chart - 24th July 2023

USDJPY Elliott Wave Analysis: Counter-Trend Corrective Mode Revealed on Day Chart - 24th July 2023

The Elliott Wave Analysis for USDJPY on the day chart, conducted on 24th July 2023, reveals a counte...

Read More >
AXIS BANK Elliott Wave Forecast Highlights Bullish Momentum on Daily and Weekly Charts with Key Trading Levels and Wave Setups

AXIS BANK Elliott Wave Forecast Highlights Bullish Momentum on Daily and Weekly Charts with Key Trading Levels and Wave Setups

AXIS BANK shows a bullish Elliott Wave structure with upward momentum on both daily and weekly chart...

Read More >

$1 for 2 Weeks

then $29 a month!

What a Special Offer!

Trade Recommendations

Unleash the power of deversified trading with our comprehensive portfolio, covering 250+ markets:

  • Stock Trades
  • Crypto Trades
  • Forex Trades
  • Commodity Trades
Elliott Wave Analysis

Gain a competitive edge with expert insights and AI-powered Elliott Wave charting into:

  • Global Indices
  • US Stocks & ASX Stocks
  • Forex & Crypto
  • Commodities
Top-Notch Trading Tools

Equip yourself with the tools of success:

  • Real-time Chat rooms
  • Elliott Wave Algorithm
  • Portfolio tools
  • TradingLevels
  • Screener
  • Trading Game
7 Elliott Wave Analysts

Stay ahead of the market with daily charts and insightful videos
Your secret to strategic trading!

JOIN HERE


Welcome to TradingLounge (ASIC A.R.No. 321187), specialists in trades, trading education and technical analysis, covering stocks, indices, commodities, forex and cryptocurrencies.

When you join TradingLounge you have access to everything we offer, including trade tools, educational content and a social platform to chat with like-minded investors.

Read more

@Copyright 2024 by tradinglounge.com

Contact Us

Australian no: 02 4787 6020

International no: +61 (2) 47876020

Pay with:

Find us on