11Apr

Cardano (ADAUSD) Elliott Wave Analysis: Price Forecast, Fibonacci Levels, Trading Strategy & Wave (III) Setup

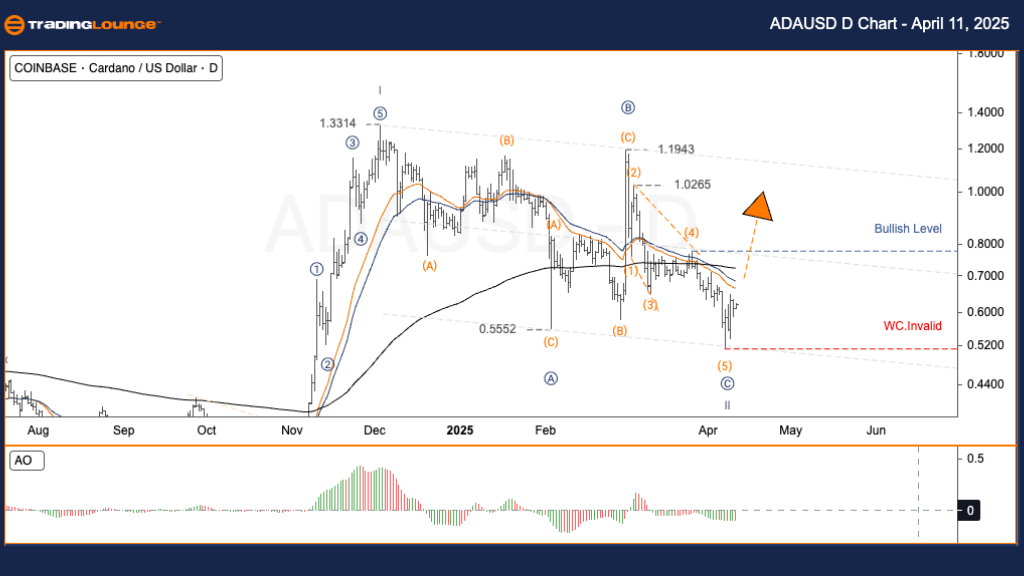
Cardano / U.S. Dollar (ADAUSD) Elliott Wave Analysis – TradingLounge Daily Chart

ADAUSD Elliott Wave Technical Analysis

Function: Counter Trend

Mode: Corrective

Structure: Flat

Position: Wave ((C))

Next Higher Degree Direction: Wave II

Invalidation Level: N/A

Cardano (ADA) Daily Chart Analysis – Trading Strategy

After peaking near $1.33 in late 2024, Cardano (ADA/USD) has entered a corrective Elliott Wave pattern labeled A–B–C. The current price action is testing a crucial Fibonacci support zone, which lies between 0.5547 and 0.4380 — the typical retracement range of wave 2 against wave 1. This area often marks the completion of wave (II) and may signal the upcoming formation of wave (III), which is typically bullish.

Trading Strategies

  • Strategy

Approach

✅ Short-Term Traders (Swing Trade):

If ADA/USD holds above the 0.55 support level and then reclaims the 0.85 resistance, this may present a valid setup to enter a potential bullish wave (III).

  • Risk Management

If ADA/USD falls below 0.321, the existing Elliott Wave structure is invalidated, necessitating a revised wave count and outlook.

ADAUSD-1d-crypto-cha...


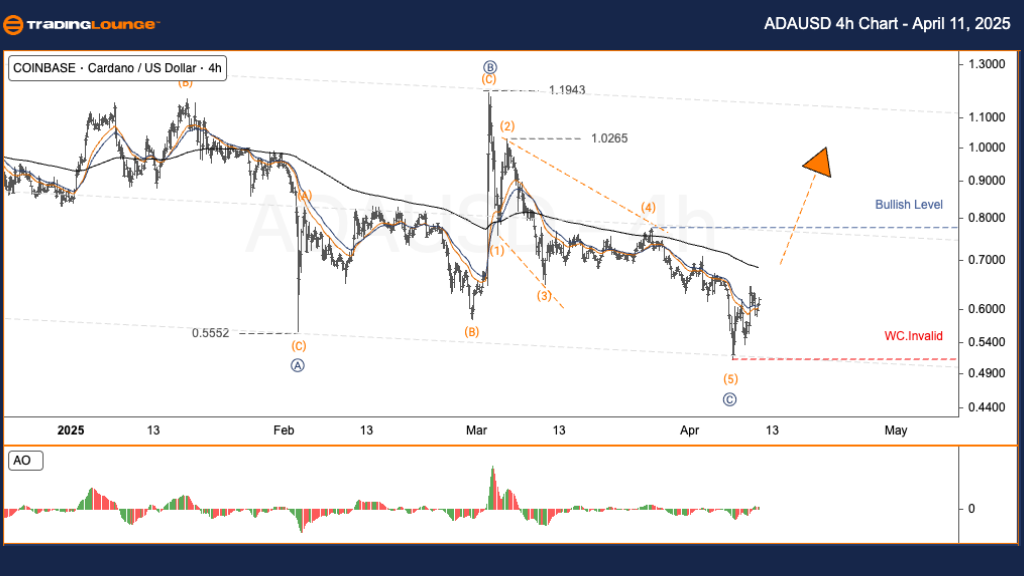
Cardano / U.S. Dollar (ADAUSD) Elliott Wave Analysis – TradingLounge H4 Chart, 11 April 2025

ADAUSD Elliott Wave Technical Analysis

Function: Counter Trend

Mode: Corrective

Structure: Flat

Position: Wave ((C))

Next Higher Degree Direction: Wave II

Invalidation Level: N/A

Cardano (ADA) 4-Hour Chart Analysis – Trading Strategy

Since topping out at $1.33 in late 2024, Cardano's price has been in a continued A–B–C correction. The token is now consolidating within a significant Fibonacci retracement area between 0.5547 and 0.4380, a frequent turning point that may conclude wave (II). If confirmed, wave (III) could initiate, suggesting strong upward momentum ahead.

Trading Strategies

  • Strategy

Approach

Short-Term Traders (Swing Trade):

Look for a potential long entry if ADAUSD remains above the 0.55 level and breaks out over 0.85, indicating a likely wave (III) rally.

  • Risk Management

A drop below 0.321 invalidates the current Elliott Wave outlook, prompting the need to reevaluate the market structure.

Technical Analyst: Kittiampon Somboonsod, CEWA

Source: Visit Tradinglounge.com and learn from the Experts. Join TradingLounge Here 

Previous: UNIUSD Elliott Wave Technical Analysis

VALUE Offer - Buy 1 Month & Get 3 Months!Click here

Access 7 Analysts Over 200 Markets Covered. Chat Room With Support

ADAUSD-4h-crypto-cha...

Related

KOSPI Composite Index: Elliott Wave Technical Analysis Provides Insights for Traders, Highlighting Market Activity

KOSPI Composite Index: Elliott Wave Technical Analysis Provides Insights for Traders, Highlighting Market Activity

KOSPI Composite Elliott Wave Analysis for the day and 4-hour chart offers a comprehensive view of th...

Read More >
Uniswap/U.S. dollar(UNIUSD) Elliott Wave Technical Analysis 18 December 23

Uniswap/U.S. dollar(UNIUSD) Elliott Wave Technical Analysis 18 December 23

Uniswap/U.S. dollar(UNIUSD) Elliott Wave Technical Analysis dated 18 December 23, Uniswap Crypto Ana...

Read More >
Comprehensive British Pound/U.S.Dollar (GBPUSD) Forex Elliott Wave Technical Analysis

Comprehensive British Pound/U.S.Dollar (GBPUSD) Forex Elliott Wave Technical Analysis

Dive into our comprehensive GBPUSD Elliott Wave analysis to understand the future price movements of...

Read More >
ARK Fintech Innovation ETF – ARKF Elliott Wave Analysis: Price Forecast, Trends, and Key Trading Strategy Insights

ARK Fintech Innovation ETF – ARKF Elliott Wave Analysis: Price Forecast, Trends, and Key Trading Strategy Insights

ARKF (ARK Fintech Innovation ETF), focusing on its current market position using Elliott Wave Theory...

Read More >
Australian Dollar/U.S. Dollar (AUDUSD) Analysis: Elliott Wave Insights, Bearish Trends, Key Levels, and Daily & 4-Hour Chart Predictions

Australian Dollar/U.S. Dollar (AUDUSD) Analysis: Elliott Wave Insights, Bearish Trends, Key Levels, and Daily & 4-Hour Chart Predictions

This analysis delves into the AUD/USD Elliott Wave structure, highlighting bearish trends, key inval...

Read More >

$1 for 2 Weeks

then $29 a month!

What a Special Offer!

Trade Recommendations

Unleash the power of deversified trading with our comprehensive portfolio, covering 250+ markets:

  • Stock Trades
  • Crypto Trades
  • Forex Trades
  • Commodity Trades
Elliott Wave Analysis

Gain a competitive edge with expert insights and AI-powered Elliott Wave charting into:

  • Global Indices
  • US Stocks & ASX Stocks
  • Forex & Crypto
  • Commodities
Top-Notch Trading Tools

Equip yourself with the tools of success:

  • Real-time Chat rooms
  • Elliott Wave Algorithm
  • Portfolio tools
  • TradingLevels
  • Screener
  • Trading Game
7 Elliott Wave Analysts

Stay ahead of the market with daily charts and insightful videos
Your secret to strategic trading!

JOIN HERE


Welcome to TradingLounge (ASIC A.R.No. 321187), specialists in trades, trading education and technical analysis, covering stocks, indices, commodities, forex and cryptocurrencies.

When you join TradingLounge you have access to everything we offer, including trade tools, educational content and a social platform to chat with like-minded investors.

Read more

@Copyright 2024 by tradinglounge.com

Contact Us

Australian no: 02 4787 6020

International no: +61 (2) 47876020

Pay with:

Find us on