25Mar

ARK Fintech Innovation ETF – ARKF Elliott Wave Analysis: Price Forecast, Trends, and Key Trading Strategy Insights

ARK Fintech Innovation ETF – ARKF (1D) Elliott Wave Technical Analysis Daily Chart

ARK Fintech Innovation ETF – ARKF Elliott Wave Technical Analysis 

Function: Major Trend

Mode: Motive

Structure: Impulse Wave

Position: Wave iii

Direction: Uptrend

Details:

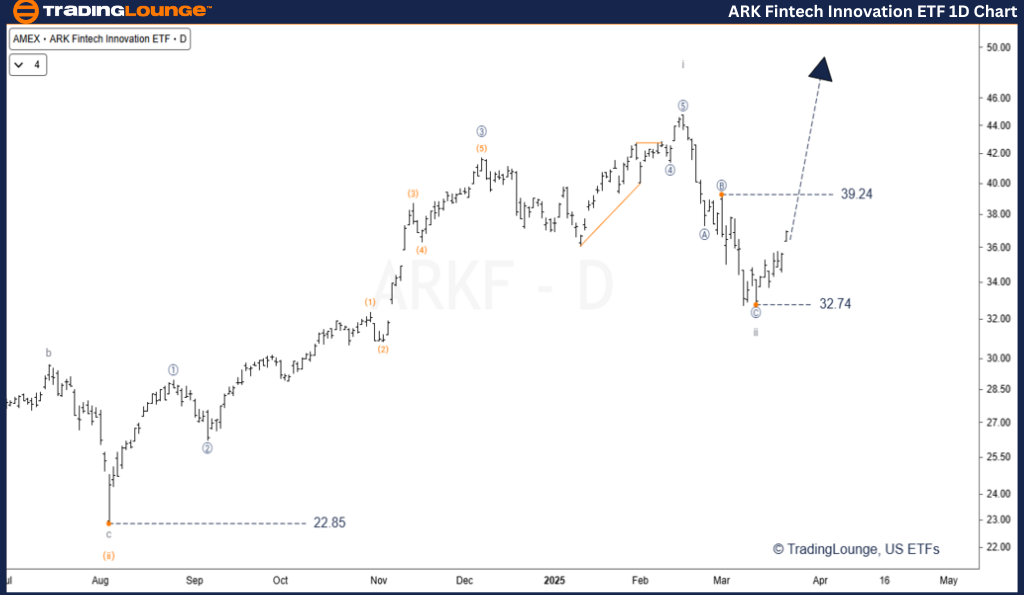
The ongoing bullish trend in ARKF is part of the third wave (wave iii), recognized for its powerful upward momentum.

This stage in the Elliott Wave cycle is historically linked to high trading volumes and aggressive price gains.

New price highs are anticipated as this phase progresses.

A full retracement of wave ii is expected as confirmation.

Invalidation Level: $47.22

ARK-Fintech-Innovati...


ARK Fintech Innovation ETF – ARKF (4H) Elliott Wave Technical Analysis 4-Hourly Chart

Function: Major Trend

Mode: Motive

Structure: Impulse

Position: Wave [1] of iii

Direction: Uptrend

Details:

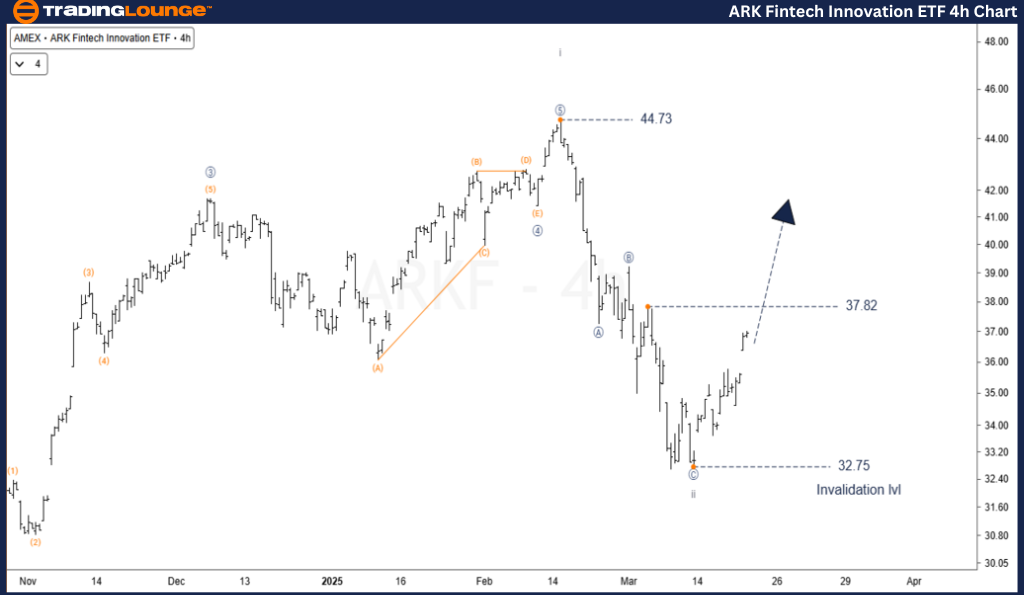
Wave ii completed at $32.75 in a classic zigzag pattern, setting the stage for the next bullish leg.

A minor bullish breakout occurred when price exceeded subwave 4 of [C] within wave ii.

Short-term price consolidation is expected near $37.82, which could precede a new upward thrust.

The previous high of $44.73 is likely to be broken during this phase.

Key support to monitor is $35.00 for potential retracement or continuation patterns.

Invalidation Level: $32.75

Technical Analyst: Siinom

Source: Visit Tradinglounge.com and learn from the Experts. Join TradingLounge Here 

See Previous: ARK Israel Innovative Technology ETF – IZRL Elliott Wave Technical Analysis

VALUE Offer - Buy 1 Month & Get 3 Months!Click here

Access 7 Analysts Over 200 Markets Covered. Chat Room With Support

ARK-Fintech-Innovati...


Conclusion:

The ARKF ETF is currently positioned in wave iii, typically the most dynamic and powerful segment of an Elliott Wave impulse.

Wave 3 phases often indicate strong upside potential, driven by high investor interest and trading volume.

This setup offers a positive outlook for bullish traders and ETF investors focusing on growth opportunities.

Strict adherence to Elliott Wave principles and close monitoring of invalidation levels like $47.22 and $32.75 are crucial for effective risk management.

Related

Our Expert Forecasts and Financial news on NASDAQ Index Elliott Wave Technical Analysis

Our Expert Forecasts and Financial news on NASDAQ Index Elliott Wave Technical Analysis

Our comprehensive guide offers a detailed look into NASDAQ Composite trading, including Elliott Wave...

Read More >
British Pound/U.S. Dollar (GBPUSD) Elliott Wave Analysis: Bullish Trend Unfolds with Orange Wave 3 Developing – Forex Trading Strategy

British Pound/U.S. Dollar (GBPUSD) Elliott Wave Analysis: Bullish Trend Unfolds with Orange Wave 3 Developing – Forex Trading Strategy

GBPUSD Elliott Wave analysis highlights a bullish trend, with Orange Wave 3 developing and signaling...

Read More >
Dogecoin Elliott Wave Analysis: DOGE Price Prediction, Wave Count, Support & Resistance Levels for Crypto Investors

Dogecoin Elliott Wave Analysis: DOGE Price Prediction, Wave Count, Support & Resistance Levels for Crypto Investors

Dogecoin Elliott Wave analysis, helping traders understand the DOGEUSD market structure. Learn about...

Read More >
Australian Dollar/U.S. Dollar (AUDUSD) Elliott Wave Analysis: Forecast Trends and Market Outlook for Forex Traders

Australian Dollar/U.S. Dollar (AUDUSD) Elliott Wave Analysis: Forecast Trends and Market Outlook for Forex Traders

AUDUSD Elliott Wave analysis provides a detailed outlook on market trends, including wave counts, tr...

Read More >
Cocoa Market Forecast 2024: Elliott Wave Technical Analysis, Trends, and Trading Opportunities

Cocoa Market Forecast 2024: Elliott Wave Technical Analysis, Trends, and Trading Opportunities

This analysis delves into the 2024 cocoa market using Elliott Wave theory. It highlights recent pric...

Read More >
Alphabet Inc.(GOOGL:NASDAQ) Elliott Wave Technical Analysis 12 January 24

Alphabet Inc.(GOOGL:NASDAQ) Elliott Wave Technical Analysis 12 January 24

Alphabet Inc.(GOOGL: NASDAQ) Elliott Wave Technical Analysis with 4h and 1h Chart dated 12 January 2...

Read More >

Buy 1 Month

Get 3 Months!

Special Offer:

Trade Recommendations

Unleash the power of deversified trading with our comprehensive portfolio, covering:

  • Stock Trades
  • Crypto Trades
  • Forex Trades
  • Commodity Trades
Elliott Wave Analysis

Gain a competive edge with expert insights in to:

  • Global Indices
  • US Stocks & ASX Stocks
  • Forex & Crypto
  • Commodities
Top-Notch Trading Tools

Equip yourself with the tools of success:

  • Social Chat
  • Elliott Wave Algorithm
  • Screener
  • TradingLevels
  • Trading Game
7 Elliott Wave Analysts

Stay ahead of the market with daily charts and insightful videos
-Your secret to strategic trading!

JOIN HERE


Welcome to TradingLounge (ASIC A.R.No. 321187), specialists in trades, trading education and technical analysis, covering stocks, indices, commodities, forex and cryptocurrencies.

When you join TradingLounge you have access to everything we offer, including trade tools, educational content and a social platform to chat with like-minded investors.

Read more

@Copyright 2024 by tradinglounge.com

Contact Us

Australian no: 02 4787 6020

International no: +61 (2) 47876020

Pay with:

Find us on