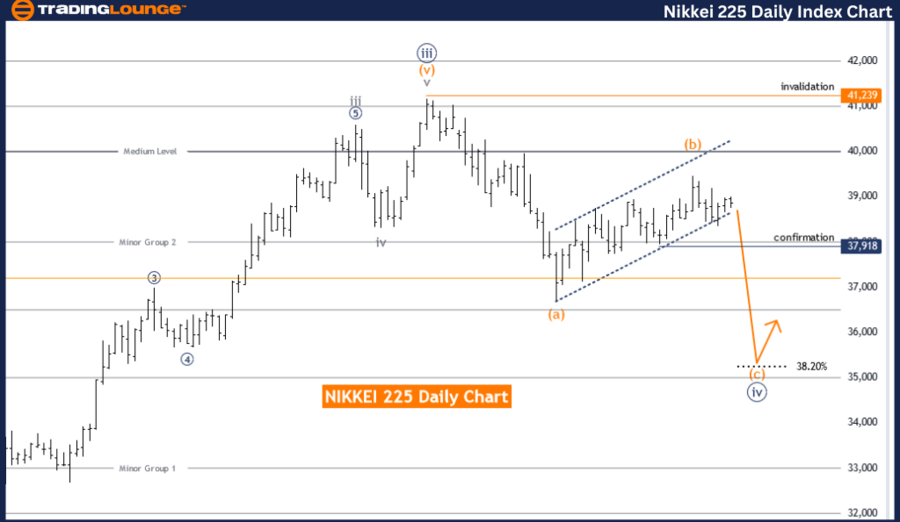
NIKKEI 225(N225) Elliott Wave Analysis Trading Lounge Day Chart,
NIKKEI 225(N225) Elliott Wave Technical Analysis
FUNCTION: Counter Trend
MODE: corrective
STRUCTURE:orange wave C
POSITION: navy blue wave 4
DIRECTION NEXT HIGHER DEGREES: navy blue wave 5
DETAILS orange wave B of wave 4 looking completed , now orange wave C is in play.
Wave Cancel invalid level: 41239
The NIKKEI 225 Elliott Wave Analysis on the daily chart focuses on understanding the current market dynamics through the lens of the Elliott Wave Principle. This analysis identifies the function as a counter trend, indicating that the market is currently in a phase that moves against the prevailing trend. The mode of this movement is corrective, meaning it is a temporary retracement or consolidation within the larger trend.
The primary wave structure under scrutiny is orange wave C, which is positioned within navy blue wave 4. This suggests that the market is in the fourth wave of a larger wave sequence, and specifically, within the third sub-wave of this fourth wave. The direction for the next higher degree is towards navy blue wave 5, which indicates that once the current corrective phase is complete, the market is expected to resume its primary trend direction in the fifth wave.
Details from the analysis highlight that orange wave B of wave 4 is likely completed, setting the stage for orange wave C to come into play. Orange wave C is part of the corrective pattern and represents the final leg of the correction before the trend resumes. The completion of orange wave B signifies a pivotal point in the market, where the correction is likely moving towards its end phase, preparing for the continuation of the main trend.
An invalidation level is set at 41239. This level is crucial because if the market price reaches or exceeds this point, it would invalidate the current wave count and necessitate a reevaluation of the wave structure. This invalidation level acts as a safeguard for traders, ensuring they can adjust their strategies if the market behaves unexpectedly.
In summary, the NIKKEI 225 Elliott Wave Analysis on the daily chart provides a detailed outlook of the market's corrective phase within a counter trend. With orange wave B of navy blue wave 4 likely completed, the focus is now on orange wave C. Traders should be aware of the invalidation level at 41239, which serves as a critical point for reassessing the wave count. This analysis aids in making informed decisions by anticipating the next phase of market movement within the Elliott Wave framework.

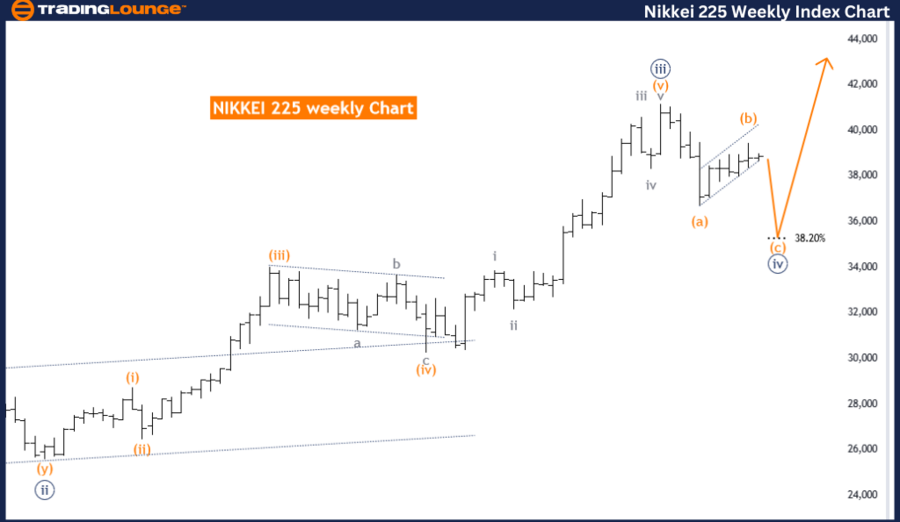
NIKKEI 225(N225) Elliott Wave Analysis Trading Lounge Weekly Chart
NIKKEI 225(N225) Elliott Wave Technical Analysis
FUNCTION: Counter Trend
MODE: corrective
STRUCTURE:orange wave C
POSITION: navy blue wave 4
DIRECTION NEXT HIGHER DEGREES: navy blue wave 5
DETAILS orange wave B of wave 4 looking completed, now orange wave C is in play.
Wave Cancel invalid level:41239
The NIKKEI 225 Elliott Wave Analysis on the weekly chart provides insights into the market's current behavior using the Elliott Wave Principle. This analysis identifies the market function as a counter trend, indicating that the current movements are against the primary trend. The mode is corrective, suggesting a temporary retracement or consolidation phase rather than a continuation of the main trend.
The primary wave structure being analyzed is orange wave C, which is part of a larger corrective pattern. This wave is positioned within navy blue wave 4, indicating that the market is in the fourth wave of a broader wave sequence. Following the completion of this corrective phase, the market is expected to proceed to navy blue wave 5, resuming the primary trend direction.
The a nalysis details that orange wave B of navy blue wave 4 appears to be complete. This completion signals a critical point in the corrective pattern, as it suggests the market has finished the preceding segment of the correction and is now transitioning into orange wave C. This wave represents the final leg of the correction before the market resumes its main trend.
A key aspect of the analysis is the invalidation level set at 41239. This level is crucial for traders and analysts because if the market price reaches or surpasses this point, the current wave count would be invalidated. This means the expected wave structure would no longer be valid, necessitating a reassessment of the market's wave patterns. The invalidation level serves as a safeguard, ensuring that strategies can be adjusted if the market does not behave as anticipated.
In summary, the NIKKEI 225 Elliott Wave Analysis on the weekly chart outlines a corrective phase within a counter trend. With orange wave B of navy blue wave 4 likely completed, the focus shifts to the development of orange wave C. This phase is critical as it marks the final part of the correction before the market resumes its primary trend towards navy blue wave 5. The analysis highlights the importance of the invalidation level at 41239, which helps in validating the current wave count and adjusting trading strategies accordingly.
Technical Analyst: Malik Awais
Source: visit Tradinglounge.com and learn From the Experts Join TradingLounge Here
See previous:S&P 500 Elliott Wave Technical Analysis
Special Trial Offer - 0.76 Cents a Day for 3 Months! Click here
Access 7 Analysts Over 170 Markets Covered. Chat Room With Support
