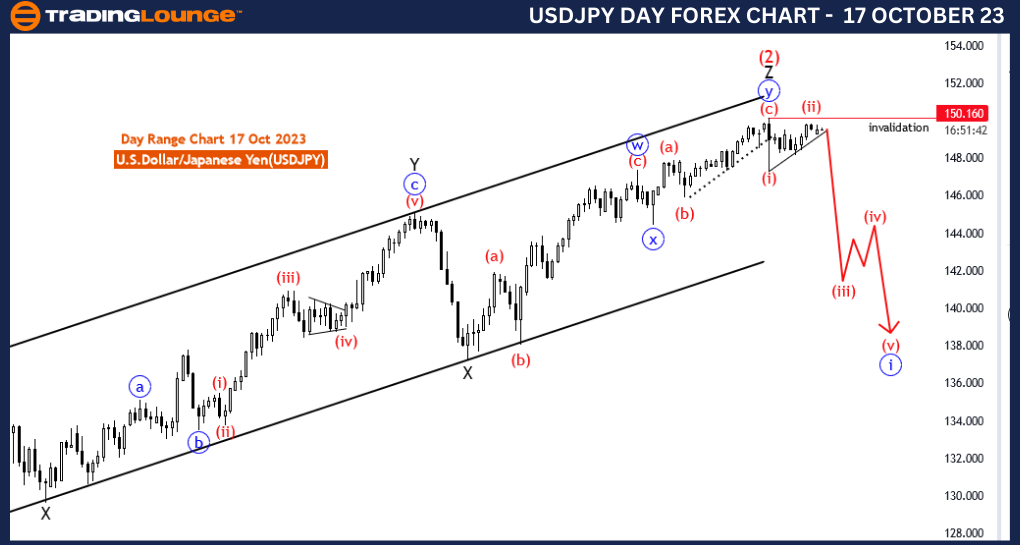
USDJPY Elliott Wave Analysis Trading Lounge 4 Hour Chart, 17 October 23
U.S.Dollar/Japanese Yen (USDJPY) 4 Hour Chart
USDJPY Elliott Wave Technical Analysis
Function: Trend
Mode: impulsive
Structure:red wave 3 of blue wave 1
Position: blue wave 1
Direction Next lower Degrees:Red wave 3(started)
Details: Red wave 2 looking completed at 149.846. Now red wave 3 is in play . Wave Cancel invalid level: 150.160
The USD/JPY Elliott Wave Analysis for the 4-hour chart on 17 October 23, presents a comprehensive overview of the market dynamics within the U.S. Dollar/Japanese Yen (USD/JPY) currency pair. Utilizing the Elliott Wave theory, a prominent analytical tool for assessing market trends and price movements, this analysis provides valuable insights into the current market conditions and potential trading opportunities.
In this analysis, the primary objective is to identify and leverage the existing trend in the USD/JPY market. The market function is characterized as trending, with an impulsive mode. According to Elliott Wave theory, impulsive waves denote strong and sustained price movements, frequently offering substantial trading prospects.
The analysis focuses on "red wave 3 of blue wave 1," pinpointing the ongoing trend and emphasizing its significance within the broader market structure. In Elliott Wave theory, the third wave is often considered the most powerful and extended wave within a sequence, making it a focal point for traders and investors.
The core wave in this analysis is "blue wave 1," which is seen as the starting point for the unfolding market trend. The transition from "red wave 2" to "red wave 3" signifies the initiation of a potentially powerful and sustained bullish movement in the USD/JPY market.
One of the key highlights of this analysis is the assertion that "Red wave 2 is looking completed at 149.846." This suggests that a potential correction has concluded, with the market ready to embark on the next impulsive wave, "red wave 3."
The analysis introduces a crucial reference point, the "Wave Cancel invalid level" located at 150.160. This level serves as a pivotal guide for traders, particularly in terms of making trading decisions and managing risk.
In summary, the USD/JPY Elliott Wave Analysis for 17 October 23 is a valuable resource for traders and investors active in the USD/JPY market. It confirms the existence of a strong impulsive wave, "red wave 3 of blue wave 1," and highlights the commencement of this wave after the completion of a corrective phase, "red wave 2." Traders and investors should closely monitor the levels provided in this analysis as they formulate their trading strategies within the USD/JPY currency pair.
Technical Analyst: Malik Awais
Source: Tradinglounge.com get trial here!
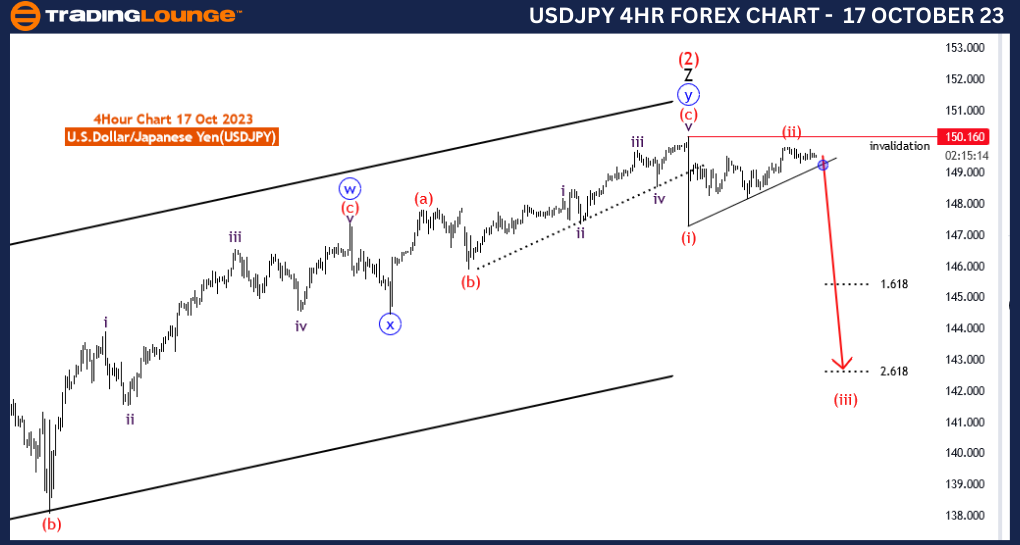
USDJPY Elliott Wave Analysis Trading Lounge Day Chart, 17 October 23
U.S.Dollar/Japanese Yen (USDJPY) Day Chart
USDJPY Elliott Wave Technical Analysis
Function: Trend
Mode: impulsive
Structure:red wave 3 of blue wave 1
Position: blue wave 1
Direction Next lower Degrees:Red wave 3(started)
Details: Red wave 2 of 1 looking completed at 149.846. Now red wave 3 of 1 is in play. Wave Cancel invalid level: 150.160
The USD/JPY Elliott Wave Analysis for the daily chart on 17 October 23, offers valuable insights into the dynamics of the U.S. Dollar/Japanese Yen (USD/JPY) currency pair. It applies the Elliott Wave theory to assess market trends and price movements, providing an informative perspective on the current market conditions and potential trading opportunities.
This analysis primarily identifies and examines the prevailing trend within the USD/JPY market. The market function is categorized as trending, with an impulsive mode. According to Elliott Wave theory, impulsive waves signify strong and sustained price movements, often presenting significant trading prospects.
The central theme of this analysis revolves around "red wave 3 of blue wave 1." This highlights the current trend and emphasizes its importance in the broader market structure. In Elliott Wave theory, the third wave is often regarded as the most influential and extended wave within a sequence, making it a focal point for traders and investors.
The key wave under scrutiny is "blue wave 1," representing the inception of the unfolding market trend. The shift from "red wave 2" to "red wave 3" signals the initiation of a potentially robust and sustained bullish movement in the USD/JPY market.
A notable feature of this analysis is the statement that "Red wave 2 of 1 is looking completed at 149.846." This suggests the conclusion of a possible correction phase, with the market now poised to commence the next impulsive wave, "red wave 3 of 1."
The analysis introduces an essential reference point, the "Wave Cancel invalid level" situated at 150.160. This level serves as a critical guide for traders, especially in terms of making trading decisions and managing risk.
In summary, the USD/JPY Elliott Wave Analysis for 17 October 23, provides valuable insights for traders and investors involved in the USD/JPY market. It confirms the presence of a strong impulsive wave, "red wave 3 of blue wave 1," and highlights the commencement of this wave after the completion of a corrective phase, "red wave 2." Traders and investors are advised to closely monitor the levels presented in this analysis as they formulate their trading strategies within the USD/JPY currency pair.
Technical Analyst: Malik Awais
Source: Tradinglounge.com get trial here!