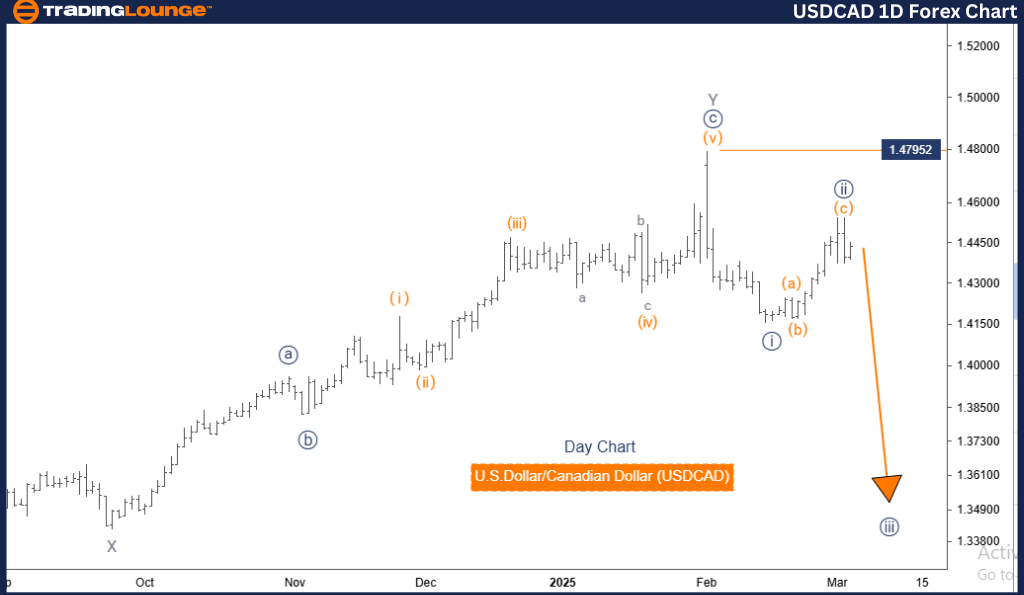
U.S. Dollar / Canadian Dollar (USDCAD) Elliott Wave Analysis – Trading Lounge Day Chart
USDCAD Elliott Wave Technical Analysis
Function: Bearish Trend
Mode: Impulsive
Structure: Navy Blue Wave 3
Position: Gray Wave 1
Direction Next Lower Degrees: Navy Blue Wave 3 (Started)
Wave Cancellation Invalid Level: 1.47952
Analysis Overview
The USDCAD Elliott Wave Analysis on the daily chart confirms a strong bearish trend, with the market currently in an impulsive phase. The structure aligns with Navy Blue Wave 3, a key wave within Gray Wave 1, indicating an ongoing downward movement.
The next expected move is the continuation of Navy Blue Wave 3, which has already begun, driving the market further downward.
Key Market Insights
- Navy Blue Wave 2 has concluded, and the market is now advancing into Navy Blue Wave 3.
- This wave is expected to sustain strong downward momentum, aligning with the impulsive nature of the trend.
- Traders should focus on Navy Blue Wave 3, as its completion could signal a potential trend transition.
- The conclusion of Navy Blue Wave 3 will offer critical insights into future market movements, influencing the next lower-degree wave.
Key Levels to Watch
- Wave Cancellation Invalid Level: 1.47952
- A price rise above this level would invalidate the current wave count, prompting a reassessment of the market structure.
- This level acts as key resistance, and a break above it could indicate a trend shift or pattern adjustment.
Conclusion
The USDCAD remains bearish, with Navy Blue Wave 3 leading the trend after the completion of Navy Blue Wave 2. This impulsive movement within Gray Wave 1 suggests continued downside momentum.
Traders should closely track Navy Blue Wave 3, as it plays a vital role in determining the next market phase. This analysis underscores the importance of Elliott Wave structures in forecasting price movements and optimizing trading strategies.
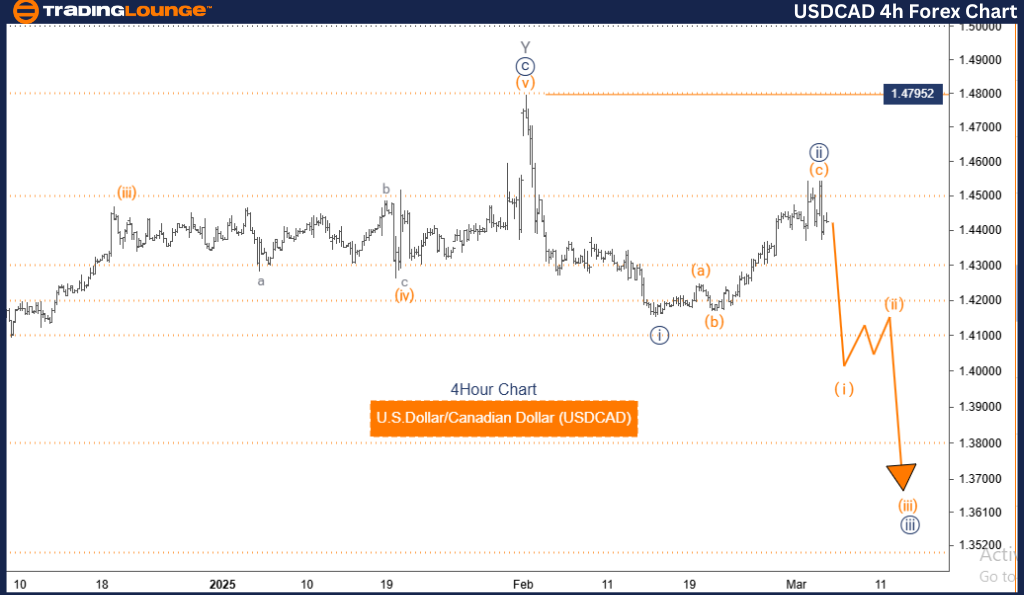
U.S. Dollar / Canadian Dollar (USDCAD) Elliott Wave Analysis – Trading Lounge 4-Hour Chart
USDCAD Elliott Wave Technical Analysis
Function: Bearish Trend
Mode: Impulsive
Structure: Orange Wave 1
Position: Navy Blue Wave 3
Direction Next Higher Degrees: Orange Wave 2
Wave Cancellation Invalid Level: 1.47952
Analysis Overview
The USDCAD Elliott Wave Analysis on the 4-hour chart confirms a bearish trend, with the market maintaining an impulsive structure. The current formation aligns with Orange Wave 1, a segment of the broader Navy Blue Wave 3, reinforcing a strong downward phase.
The next anticipated move is Orange Wave 2, which is expected to follow the completion of Orange Wave 1.
Key Market Insights
- Navy Blue Wave 2 has concluded, and the market has transitioned into Orange Wave 1 of 3.
- This wave is expected to sustain downward pressure, consistent with the impulsive nature of the trend.
- Traders should track Orange Wave 1’s progress, as its completion could signal the onset of Orange Wave 2.
- Orange Wave 2, being a corrective phase, may introduce temporary pullbacks or consolidation before the primary downtrend resumes.
Key Levels to Watch
- Wave Cancellation Invalid Level: 1.47952
- A price move above this level would invalidate the current Elliott Wave count, requiring a structural reassessment.
- This level acts as key resistance, and a break above it may indicate trend reversal or pattern adjustment.
Conclusion
The USDCAD remains bearish, with Orange Wave 1 actively shaping the trend following the completion of Navy Blue Wave 2. This impulsive phase within Navy Blue Wave 3 suggests that the next significant movement will be Orange Wave 2.
Traders should closely monitor Orange Wave 1, as its conclusion will provide critical insights into the next Elliott Wave phase. This analysis highlights the importance of Elliott Wave theory in predicting market trends and aligning trading strategies accordingly.
Technical Analyst: Malik Awais
Source: visit Tradinglounge.com and learn From the Experts Join TradingLounge Here
Previous: GBPJPY Elliott Wave Technical Analysis
VALUE Offer - Buy 1 Month & Get 3 Months!Click here
Access 7 Analysts Over 200 Markets Covered. Chat Room With Support