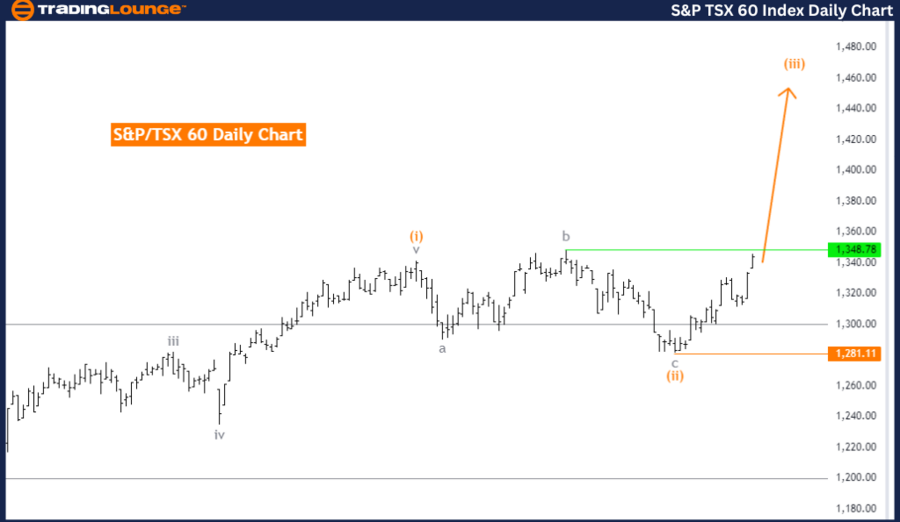
S&P/TSX 60 Elliott Wave Analysis Trading Lounge Day Chart
S&P/TSX 60 Elliott Wave Technical Analysis
FUNCTION: Trend
MODE: Impulsive
STRUCTURE: Orange Wave 3
POSITION: Navy Blue Wave 3
DIRECTION NEXT HIGHER DEGREES: Orange Wave 3 (started)
DETAILS: Orange Wave 2 of Navy Blue Wave 3 is completed. Now, Orange Wave 3 is in play.
WAVE CANCEL INVALID LEVEL: 1281.11
The S&P/TSX 60 Elliott Wave Analysis on the day chart shows an impulsive trend movement, highlighting strong and directional market behavior. The focus is on Orange Wave 3, within Navy Blue Wave 3. This positioning indicates the market is in the third wave of a larger third wave, suggesting significant and sustained momentum in the current trend.
The analysis states that the direction for the next higher degrees remains within Orange Wave 3, which has already started. This suggests that the impulsive movement will continue, reinforcing the ongoing trend's strength.
Details indicate that Orange Wave 2 of Navy Blue Wave 3 is completed. This phase suggests the market has moved past a corrective phase and is now progressing in Orange Wave 3. The completion of Orange Wave 2 indicates the market is gaining momentum as it advances into the next wave phase.
Currently, Orange Wave 3 is in play, marking a continuation of the strong upward trend within the broader Elliott Wave framework. The market's position within Navy Blue Wave 3, specifically in Orange Wave 3, signifies a period of robust market activity and directionality.
A critical aspect of this analysis is the wave cancellation invalid level, set at 1281.11. If the market price drops below this level, it would invalidate the current wave analysis. This invalidation point is crucial for traders as it serves as a risk management tool, indicating a significant shift in market dynamics if breached.
In summary, the S&P/TSX 60 day chart analysis identifies a strong, impulsive trend within the Elliott Wave framework, focusing on Orange Wave 3 within Navy Blue Wave 3. The market has completed Orange Wave 2 and is now progressing in Orange Wave 3, indicating continued momentum. The wave cancellation invalid level at 1281.11 is a key risk management point for validating the current wave analysis.
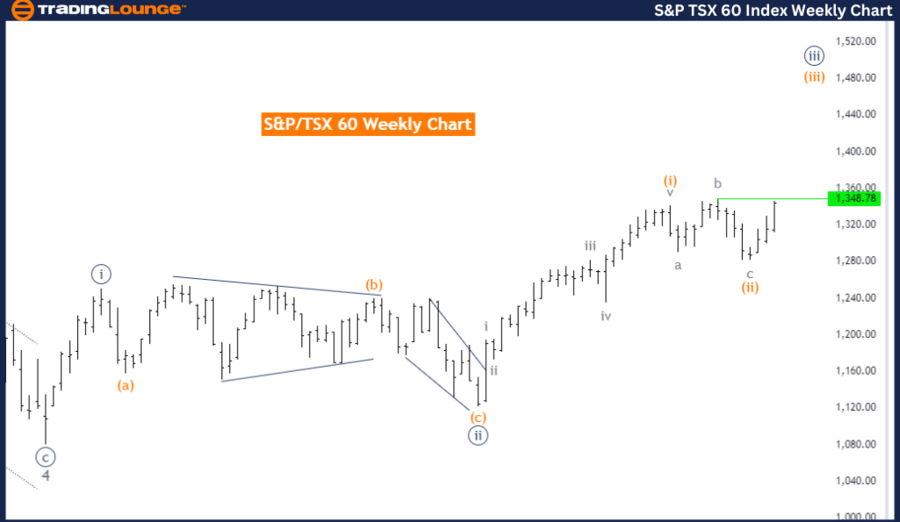
S&P/TSX 60 Elliott Wave Analysis Trading Lounge Weekly Chart
S&P/TSX 60 Elliott Wave Technical Analysis
FUNCTION: Trend
MODE: Impulsive
STRUCTURE: Orange Wave 3
POSITION: Navy Blue Wave 3
DIRECTION NEXT LOWER DEGREES: Orange Wave 4
DETAILS: Orange Wave 2 of Navy Blue Wave 3 is completed. Now, Orange Wave 3 is in play.
WAVE CANCEL INVALID LEVEL: 1281.11
The S&P/TSX 60 Elliott Wave Analysis on the weekly chart identifies the current market behavior as impulsive, indicating a strong and definitive direction. The wave structure under analysis is Orange Wave 3, within Navy Blue Wave 3, suggesting significant upward momentum within the larger third wave.
The direction for the next lower degrees is indicated as Orange Wave 4, implying that after the completion of the current impulsive wave, a corrective phase might follow. However, the market is currently progressing within Orange Wave 3.
Details highlight that Orange Wave 2 of Navy Blue Wave 3 is completed. This phase marks the end of a corrective move and the beginning of a new impulsive wave. The completion of Orange Wave 2 indicates that the market has finished its corrective phase and is now advancing in Orange Wave 3, signifying robust market activity and sustained upward movement.
Presently, Orange Wave 3 is in play, indicating a continuation of the strong trend within the broader Elliott Wave framework. The market's position within Navy Blue Wave 3, specifically in Orange Wave 3, underscores the current strong upward trajectory.
An important aspect of this analysis is the wave cancellation invalid level, set at 1281.11. If the market price drops below this level, it would invalidate the current wave count. This invalidation point is crucial for traders as it serves as a benchmark for risk management, indicating a potential shift in market dynamics if breached.
In summary, the S&P/TSX 60 weekly chart analysis identifies an impulsive trend within the Elliott Wave structure, focusing on Orange Wave 3 within Navy Blue Wave 3. The market has completed Orange Wave 2 and is now progressing in Orange Wave 3, indicating continued upward momentum. The wave cancellation invalid level at 1281.11 is a key risk management point to validate the current wave count.
Technical Analyst: Malik Awais
Source: visit Tradinglounge.com and learn From the Experts Join TradingLounge Here
See previous: Euro Stoxx 50 Elliott Wave Technical Analysis
Special Trial Offer - 0.76 Cents a Day for 3 Months! Click here
Access 7 Analysts Over 170 Markets Covered. Chat Room With Support