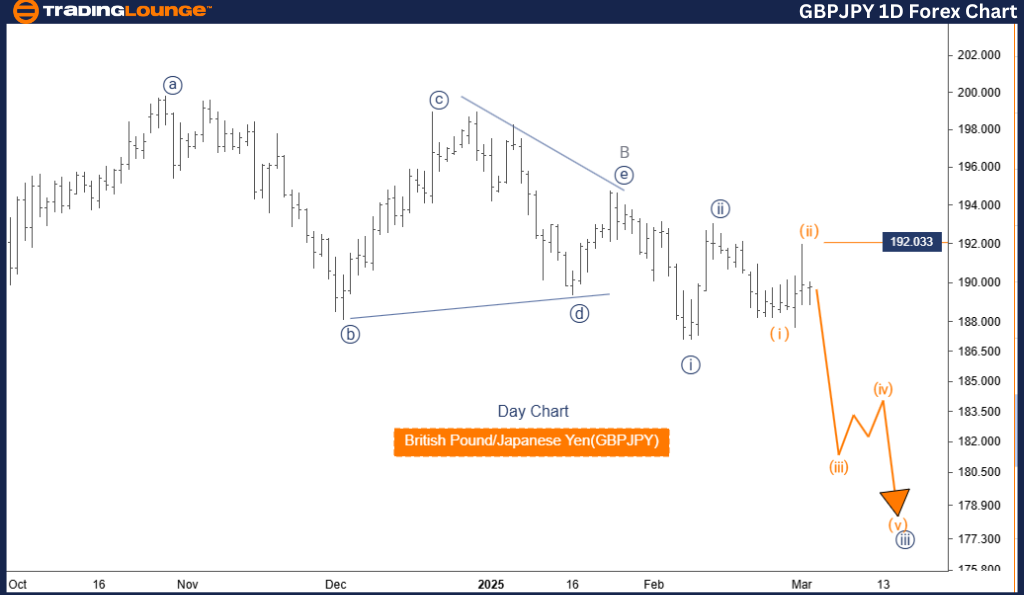
British Pound/Japanese Yen (GBPJPY) Elliott Wave Analysis – Trading Lounge Day Chart
GBPJPY Elliott Wave Technical Analysis
Function: Bearish Trend
Mode: Impulsive
Structure: Orange Wave 3
Position: Navy Blue Wave 3
Next Higher Degree Direction: Orange Wave 4
Details: Orange Wave 2 has likely completed, and Orange Wave 3 is currently active.
Invalidation Level: 192.033
Analysis Overview
The GBPJPY daily chart indicates a strong bearish trend with an impulsive wave structure. Currently, the price action is within Orange Wave 3, reflecting a sustained downward movement. The previous Orange Wave 2 appears complete, and the transition into Wave 3 signifies continued selling pressure, reinforcing a bearish market outlook.
At the current position within Navy Blue Wave 3, the market is exhibiting increased downside momentum. The next key wave development to watch is Orange Wave 4, which will emerge after Orange Wave 3 finalizes. This anticipated shift suggests that the market will remain under bearish influence until a correction initiates.
A crucial level to monitor is the 192.033 invalidation point. If the price moves above this threshold, the current Elliott Wave count will be invalidated, necessitating a reassessment of the market structure.
Conclusion
GBPJPY remains in a firm bearish phase, with Orange Wave 3 unfolding after Orange Wave 2’s completion. The downward trend persists, making it essential for traders to track key price levels to assess potential trend shifts or confirmations. The completion of Orange Wave 3 will dictate when Orange Wave 4 begins, marking a potential correction phase in the market.
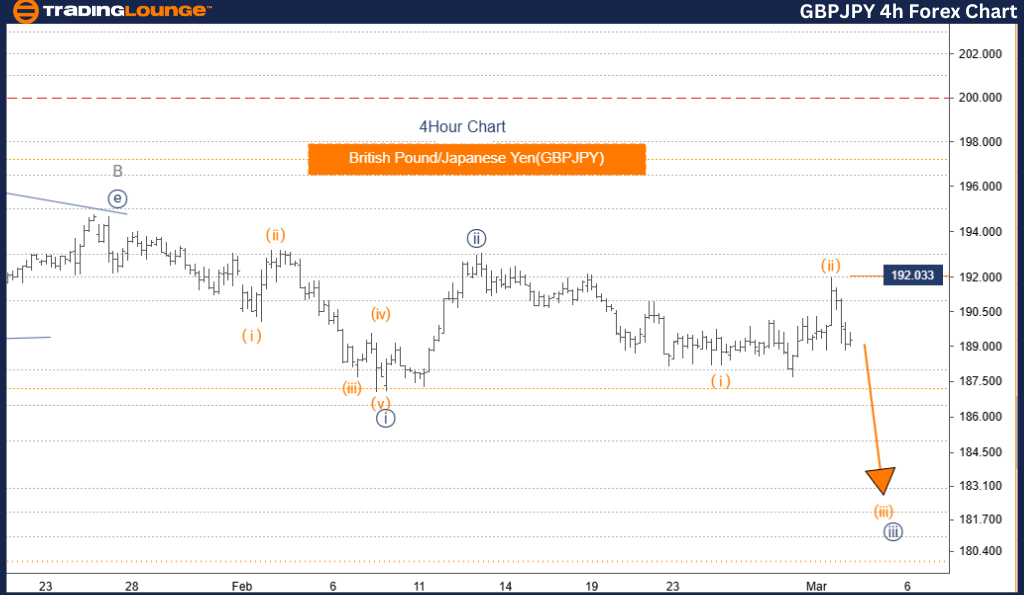
British Pound/Japanese Yen (GBPJPY) Elliott Wave Analysis – Trading Lounge 4-Hour Chart
GBPJPY Elliott Wave Technical Analysis
Function: Bearish Trend
Mode: Impulsive
Structure: Orange Wave 3
Position: Navy Blue Wave 3
Next Higher Degree Direction: Orange Wave 4
Details: Orange Wave 2 has likely completed, and Orange Wave 3 is currently active.
Invalidation Level: 192.033
Analysis Overview
The GBPJPY 4-hour chart further confirms the bearish trend, with the market in an impulsive phase within Orange Wave 3. This wave structure aligns with Navy Blue Wave 3, signaling continued downward movement. The next anticipated market shift at a higher wave degree is Orange Wave 4, expected to develop once Orange Wave 3 concludes.
The chart suggests that Orange Wave 2 has completed, and the market is now advancing through Orange Wave 3, displaying strong downside momentum. Given the impulsive nature of this wave, traders should closely monitor price action, as the eventual completion of Wave 3 will likely lead to the formation of Wave 4, which could introduce temporary corrections or consolidation before the dominant bearish trend resumes.
The 192.033 invalidation level is a critical resistance zone. If breached, this would invalidate the current Elliott Wave count, requiring a fresh structural assessment of the trend. A break above this level could signal a potential shift in market sentiment or wave pattern adjustments.
Conclusion
GBPJPY remains in a clear bearish trend, with Orange Wave 3 developing after Wave 2’s completion. The impulsive movement within Navy Blue Wave 3 suggests further downside potential before a corrective phase initiates. The next significant wave formation to observe is Orange Wave 4, expected once Wave 3 completes. Traders should pay close attention to key price levels, as they will provide critical insights into market direction and trading opportunities.
Technical Analyst: Malik Awais
Source: visit Tradinglounge.com and learn From the Experts Join TradingLounge Here
Previous: USDCHF Elliott Wave Technical Analysis
VALUE Offer - Buy 1 Month & Get 3 Months!Click here
Access 7 Analysts Over 200 Markets Covered. Chat Room With Support