The Coca-Cola Company., Elliott Wave Technical Analysis
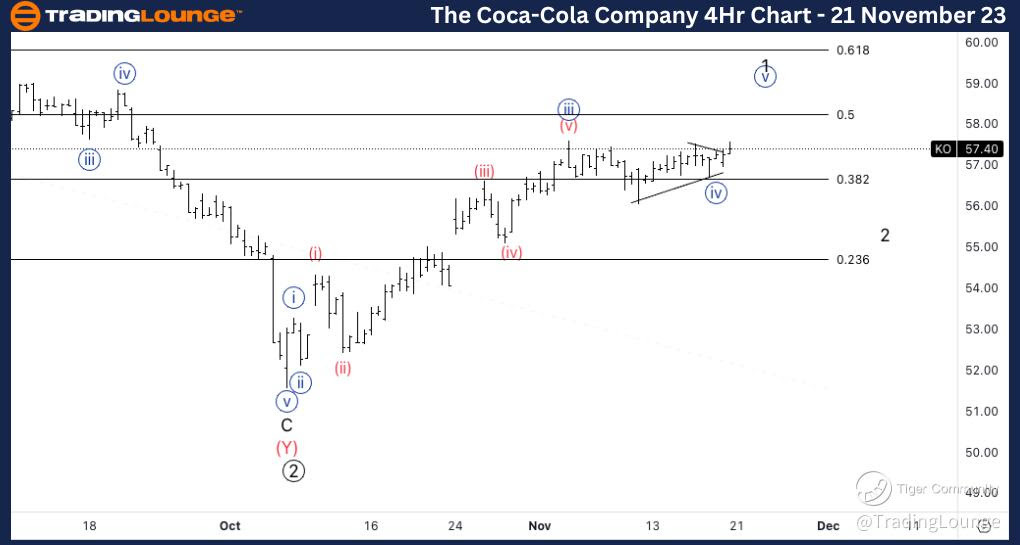
The Coca-Cola Company., (KO:NYSE): 4h Chart 21 November 23
KO Stock Market Analysis: We have been monitoring Coca-Cola's price for a few days now as we have been trading just below 58$. We seem to be in a corrective structure which could take us higher into wave {v} of 1. 50% retracement of the entire move down stands at slightly above 58$.
KO Elliott Wave Count: Wave {iv} of 1.
KO Technical Indicators: Support on the 20EMA
KO Trading Strategy: Looking for longs into wave 1.
TradingLounge Analyst: Alessio Barretta
Source: Tradinglounge.com get trial here!
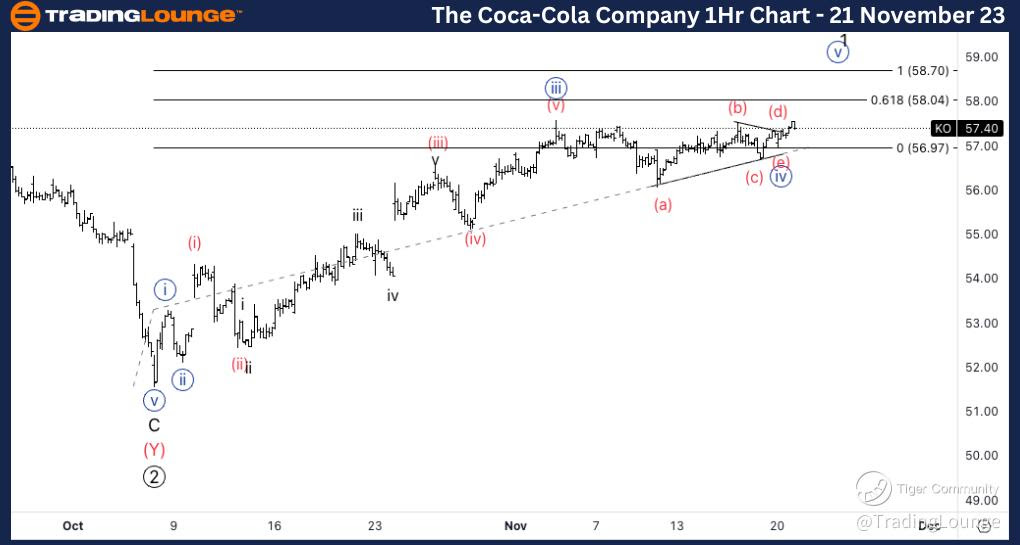
The Coca-Cola Company., KO: 1-hour Chart 21 November 23
The Coca-Cola Company., Elliott Wave Technical Analysis
KO Stock Market Analysis: We seem to be in a potential triangle in wave {iv} or else as sideways complex correction. We could start to see resistance once we reach 58$.
KO Elliott Wave count: Wave (e) of {iv}
KO Technical Indicators: Above all averages.
KO Trading Strategy: Looking for longs into wave {v}.