ADANI PORTS & SEZ Elliott Wave Analysis | Trading Lounge Day Chart
ADANI PORTS & SEZ – Day Chart Analysis
ADANI PORTS & SEZ Elliott Wave Technical Analysis
Function: Bullish Trend
Mode: Impulsive
Structure: Gray Wave 3
Position: Orange Wave 1
Direction Next Lower Degrees: Gray Wave 4
Details: Gray wave 2 looks completed, with gray wave 3 of orange wave 1 now unfolding.
Wave Cancel Invalidation Level: 1040
The ADANI PORTS & SEZ daily chart highlights a strong bullish trend progressing within an impulsive Elliott Wave structure. After completing the gray wave 2 correction, ADANI PORTS & SEZ has entered gray wave 3, advancing within the broader orange wave 1 formation. This marks the beginning of a dynamic upward phase often associated with powerful price expansions and accelerating momentum.
Gray Wave 3 Progression
Gray wave 3 typically represents the strongest segment of an Elliott Wave cycle, delivering robust and extended price movements. The completion of gray wave 2 has laid the foundation for this powerful advance. Current Elliott Wave analysis for ADANI PORTS & SEZ suggests a sustained bullish trend, as wave 3 often extends beyond the range of wave 1.
A critical invalidation point remains at 1040. A decisive move below this level would invalidate the bullish scenario and necessitate a reevaluation of the wave structure. Holding above this level preserves the bullish Elliott Wave count and trading bias.
Trading Strategy and Market Outlook
The daily Elliott Wave setup for ADANI PORTS & SEZ presents compelling opportunities for bullish trades. Wave 3 phases are typically marked by strong momentum, making this stage ideal for trend-trading strategies. Traders should monitor momentum indicators, volume patterns, and price action to confirm the wave structure's strength.
Following the completion of gray wave 3, a corrective gray wave 4 is anticipated, potentially offering a retracement opportunity before further bullish continuation. Overall, the daily chart outlook remains favorable for positioning within the dominant bullish trend.

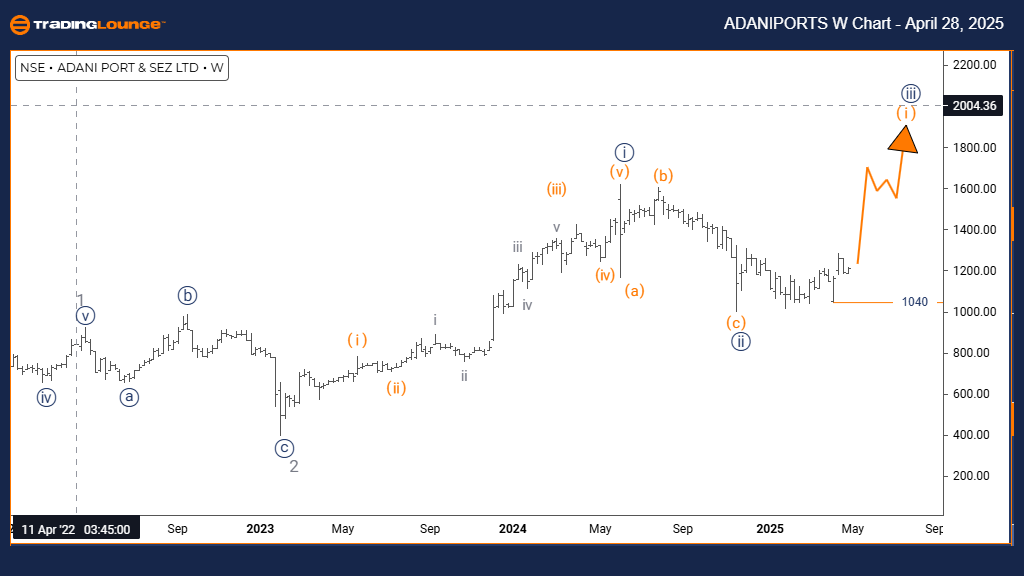
ADANI PORTS & SEZ – TradingLounge Weekly Chart
ADANI PORTS & SEZ Elliott Wave Technical Analysis
Function: Bullish Trend
Mode: Impulsive
Structure: Orange Wave 1
Position: Navy Blue Wave 3
Direction Next Lower Degrees: Orange Wave 2
Details: Navy blue wave 2 seems complete, and orange wave 1 of navy blue wave 3 is now developing.
Wave Cancel Invalidation Level: 1040
The ADANI PORTS & SEZ weekly chart analysis confirms a bullish trend, evolving within a larger impulsive Elliott Wave structure. After completing navy blue wave 2, ADANI PORTS & SEZ has entered orange wave 1 of navy blue wave 3, setting the stage for a new impulsive rally.
Orange Wave 1 Progression
Orange wave 1 typically initiates a new bullish sequence, characterized by a gradual build-up of buying momentum. The end of navy blue wave 2 clears the way for steady upward progress. Current Elliott Wave projections for ADANI PORTS & SEZ suggest continued bullish strength, although initial advances in wave 1 may be moderate compared to later stages.
The weekly time frame indicates the beginning of an intermediate bullish trend, positioning ADANI PORTS & SEZ for potentially stronger upward moves as the larger navy blue wave 3 unfolds.
Trading Strategy and Market Outlook
The key invalidation level remains at 1040, serving as crucial support. A breach of this level would challenge the current Elliott Wave count and require strategy adjustments.
Early signs of an emerging bullish wave include increasing trading volume and consistent higher closes. Traders looking to position early in a larger trend should monitor orange wave 1 closely.
Upon completion of orange wave 1, a corrective orange wave 2 is expected, providing a potential pullback opportunity before a stronger bullish continuation into navy blue wave 3. The weekly Elliott Wave analysis supports a bullish intermediate-term strategy for ADANI PORTS & SEZ.
Technical Analyst: Malik Awais
Source: Visit Tradinglounge.com and learn from the Experts. Join TradingLounge Here
Previous: INFOSYS Elliott Wave Technical Analysis
VALUE Offer - Buy 1 Month & Get 3 Months!Click here
Access 7 Analysts Over 200 Markets Covered. Chat Room With Support