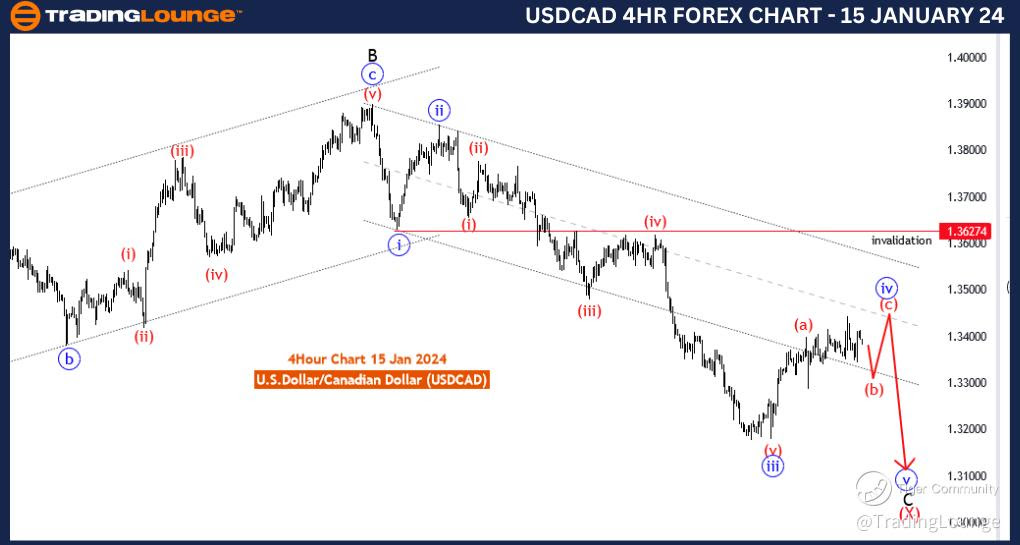
USD/CAD Elliott Wave Analysis Trading Lounge 4 Hour Chart, 15 January 24
U.S.Dollar /Canadian Dollar(USD/CAD) 4 Hour Chart
USD/CAD Elliott Wave Technical Analysis
Function: Counter Trend
Mode: Corrective
Structure: red wave B of 4
Position: black wave C
Direction Next Higher Degrees: red wave C of 4
Details: red wave A of 4 looking completed at 1.34021. Now red wave Bof 4 is in play . Wave Cancel invalid level:1.36274
The "USD/CAD Elliott Wave Analysis Trading Lounge 4 Hour Chart" for 15 January 24, provides a detailed examination of the U.S. Dollar/Canadian Dollar (USD/CAD) currency pair using Elliott Wave analysis. This analysis is conducted on a 4-hour timeframe, offering insights into potential market movements with a focus on corrective structures.
The identified "Function" is labeled as "Counter Trend," indicating that the analysis is primarily concerned with understanding and evaluating corrective movements within the broader trend. Counter-trend analysis is crucial for traders seeking opportunities in market retracements or reversals.
The specified "Mode" is characterized as "Corrective," highlighting that the current market phase is corrective in nature. Corrective waves involve price movements against the prevailing trend, providing opportunities for traders to navigate counter trend price actions.
The primary "Structure" is described as "red wave B of 4," signaling that the market is currently within a corrective phase labeled as red wave B within the broader Elliott Wave count. Understanding the structure of corrective waves is essential for anticipating potential price movements and formulating trading strategies.
The identified "Position" is labeled as "black wave C," indicating that the current corrective wave (red wave B of 4) is composed of sub-waves labeled black wave A, black wave B, and the ongoing black wave C.
In terms of "Direction Next Higher Degrees," the analysis points to the anticipated "red wave C of 4." This signifies that, following the completion of the current corrective structure (red wave B of 4), the subsequent move is expected to be another impulsive wave labeled red wave C of 4.
The "Details" section notes that "red wave A of 4" is considered completed at 1.34021. Now, the market is in the corrective phase of red wave B of 4. Understanding the completion of sub-waves within the broader Elliott Wave count is crucial for accurate wave analysis.
The "Wave Cancel invalid level" is identified as "1.36274." This level serves as a critical reference point, and if the market surpasses this level, it would invalidate the current wave count, prompting traders to reassess their analysis and potentially indicating a change in the anticipated market direction.
In summary, the USD/CAD Elliott Wave Analysis for the 4-hour chart on 15 January 24, suggests that the market is currently in a corrective phase (red wave B of 4) following the completion of red wave A of 4. The anticipated direction for the next higher degree is red wave C of 4. Traders are advised to monitor the progression of the corrective wave and consider the invalidation level at 1.36274
Technical Analyst: Malik Awais
Source: Tradinglounge.com get trial here!
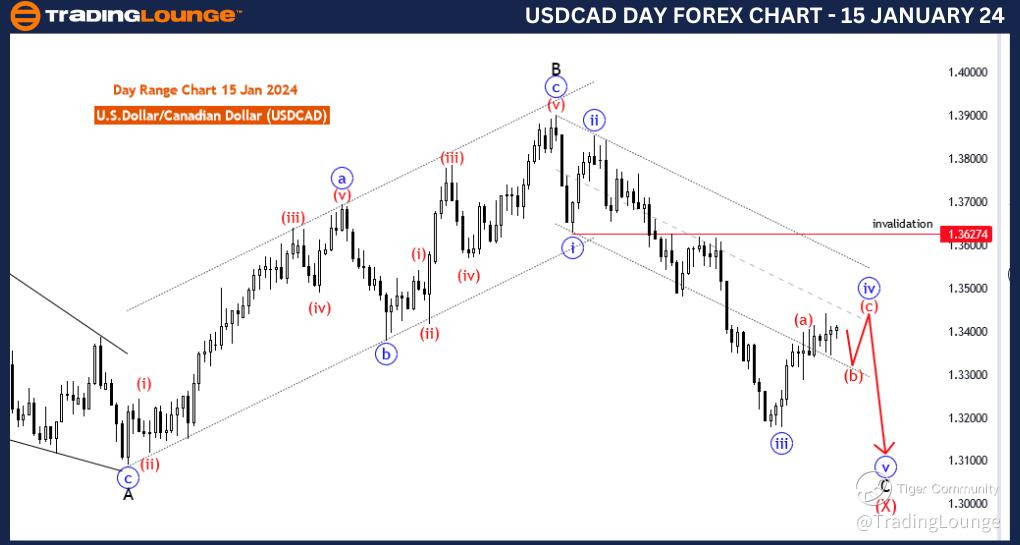
USD/CAD Elliott Wave Analysis Trading Lounge Day Chart, 15 January 24
U.S.Dollar /Canadian Dollar(USD/CAD) Day Chart
USD/CAD Elliott Wave Technical Analysis
Function: Counter Trend
Mode: Corrective
Structure: likely zigzag in wave 4
Position: C of X
Direction Next Lower Degrees: blue wave 5 of C
Details: Blue wave 4 is in play, after that 5 of C expected. Wave Cancel invalid level:1.36274
The "USD/CAD Elliott Wave Analysis Trading Lounge Day Chart" dated 15 January 24, provides a comprehensive examination of the U.S. Dollar/Canadian Dollar (USD/CAD) currency pair using Elliott Wave analysis on a daily timeframe. The analysis focuses on understanding potential market movements, emphasizing corrective structures within the broader trend.
The identified "Function" is labeled as "Counter Trend," suggesting that the analysis is primarily concerned with evaluating corrective movements against the prevailing trend. Counter-trend analysis is crucial for traders seeking opportunities in market retracements or reversals.
The specified "Mode" is characterized as "Corrective," indicating that the current market phase is corrective in nature. Corrective waves involve price movements against the primary trend and are crucial for understanding potential reversals or retracements.
The primary "Structure" is described as a "likely zigzag in wave 4," indicating that the current corrective pattern is possibly forming a zigzag structure within the broader Elliott Wave count. Recognizing specific wave patterns is essential for traders to anticipate potential price movements accurately.
The identified "Position" is labeled as "C of X," signaling that the market is currently within a complex corrective structure labeled as C of X. Complex corrections often involve multiple sub-waves and can provide challenging but rewarding trading opportunities.
In terms of "Direction Next Lower Degrees," the analysis points to the anticipated "blue wave 5 of C." This signifies that, following the completion of the current corrective structure (C of X), the subsequent move is expected to be an impulsive wave labeled blue wave 5 of C.
The "Details" section notes that "Blue wave 4 is in play," indicating that the market is currently within the corrective phase of the broader Elliott Wave count. After the completion of blue wave 4, the expectation is for blue wave 5 of C.
The "Wave Cancel invalid level" is identified as "1.36274." This level serves as a crucial reference point, and if the market surpasses this level, it would invalidate the current wave count, prompting traders to reassess their analysis and potentially indicating a change in the anticipated market direction.
In summary, the USD/CAD Elliott Wave Analysis for the daily chart on 15 January 24, suggests that the market is currently undergoing a corrective phase (C of X), with a likely zigzag structure in wave 4. The anticipated direction for the next lower degree is blue wave 5 of C. Traders are advised to monitor the progression of the corrective wave and consider the invalidation level at 1.36274.
Technical Analyst: Malik Awais
Source: Tradinglounge.com get trial here!