AUDUSD Elliott Wave Analysis – Trading Lounge Daily Chart
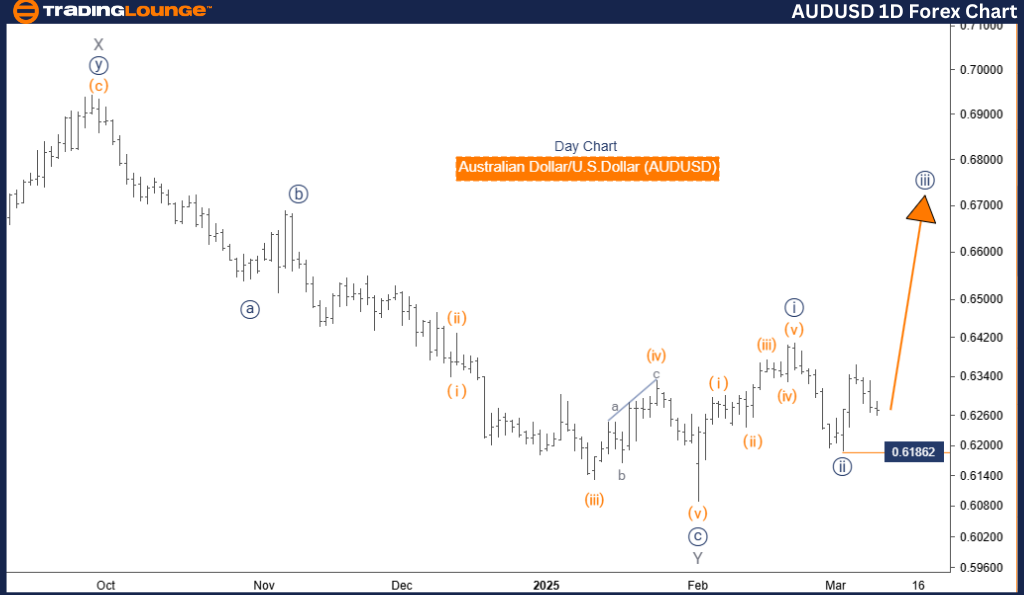
Australian Dollar/U.S. Dollar (AUDUSD) – Daily Chart Analysis
AUDUSD Elliott Wave Technical Analysis
Function: Bullish Trend
Mode: Impulsive
Structure: Navy Blue Wave 3
Position: Gray Wave 1
Next Higher Degree Direction: Navy Blue Wave 3 (Started)
Wave Cancellation Invalid Level: 0.61862
AUDUSD Analysis Details
The AUDUSD Elliott Wave Analysis for the daily chart signals a bullish trend, with the market in an impulsive mode. The current wave structure is identified as navy blue wave 3, forming part of a larger upward movement within gray wave 1. This confirms a strong bullish phase aligned with an impulsive wave structure.
The next expected movement is the continuation of navy blue wave 3, which has already initiated, suggesting further market upside.
This analysis suggests that navy blue wave 2 has likely completed, with the market now advancing into navy blue wave 3, expected to demonstrate strong bullish momentum. Traders should closely monitor its development, as its completion will indicate a significant turning point in the Elliott Wave cycle. Understanding the timing and direction of the next higher-degree wave is crucial for effective trading strategies.
Key Level to Watch
A critical price level to observe is the wave cancellation invalid level at 0.61862. If the price drops below this level, the current wave count will be invalidated, necessitating a reassessment of the market structure. This level serves as key support, and a breach may indicate a trend shift or wave pattern alteration.
Conclusion
The AUDUSD remains in a bullish trend, with navy blue wave 3 in progress after the completion of navy blue wave 2. This impulsive movement is part of gray wave 1, and the next significant step is the continuation of navy blue wave 3. Traders should closely monitor the progression of navy blue wave 3, as it provides valuable insights into the next higher-degree wave's timing and direction. Understanding wave structures is essential for anticipating market movements and aligning trading strategies effectively.
Australian Dollar/U.S. Dollar (AUDUSD) – 4-Hour Chart
AUDUSD Elliott Wave Technical Analysis
Function: Bullish Trend
Mode: Impulsive
Structure: Orange Wave 3
Position: Navy Blue Wave 3
Next Higher Degree Direction: Orange Wave 3 (Started)
Wave Cancellation Invalid Level: 0.61862
Analysis Details
The AUDUSD Elliott Wave Analysis for the 4-hour chart highlights a bullish trend, with the market in an impulsive mode. The wave structure is recognized as orange wave 3, forming part of a larger upward movement within navy blue wave 3. This confirms a strong bullish phase, characteristic of an impulsive wave structure.
The next projected movement is the continuation of orange wave 3, which has already begun and is expected to drive the market higher.
The analysis suggests that orange wave 2 has likely completed, with the market now advancing through orange wave 3, expected to maintain strong bullish momentum. Traders should closely track this wave's development, as its completion will signal the start of a new phase in the market cycle. This will be a key inflection point, offering insights into the next higher-degree wave's timing and direction.
Key Level to Watch
A critical price level to monitor is the wave cancellation invalid level at 0.61862. If the price breaks below this level, the current wave count would be invalidated, requiring a reassessment of the market structure. This level acts as key support, and its breach could indicate a potential trend shift or wave pattern change.
Conclusion
The AUDUSD remains in a bullish trend, with orange wave 3 currently developing after the completion of orange wave 2. This impulsive movement is part of navy blue wave 3, and the next major step is the continuation of orange wave 3. Traders should closely observe the development of orange wave 3, as it offers critical insights into the next higher-degree wave's direction and timing. This analysis highlights the importance of understanding wave structures to anticipate market movements and optimize trading strategies accordingly.
Technical Analyst: Malik Awais
Source: Visit Tradinglounge.com and learn from the Experts Join TradingLounge Here
Previous: GBPUSD Elliott Wave Technical Analysis
VALUE Offer - Buy 1 Month & Get 3 Months!Click here
Access 7 Analysts Over 200 Markets Covered. Chat Room With Support
