25Apr

INFOSYS Elliott Wave Forecast: Wave 4 Correction Nears Completion Before Potential Wave 5 Decline – Key Trade Setup Levels

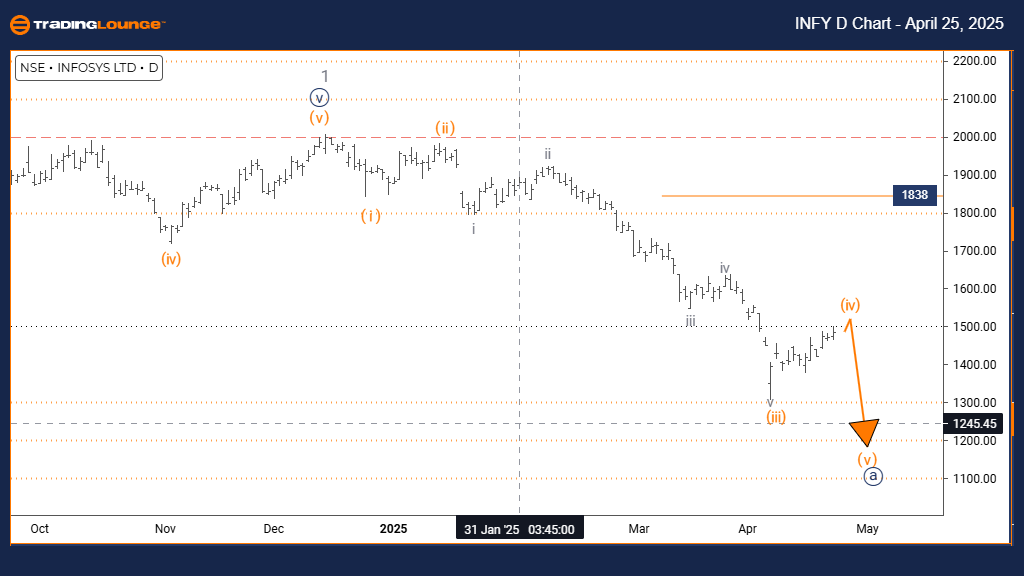
INFOSYS Elliott Wave Analysis – TradingLounge Daily Chart

INFOSYS Stock Daily Chart Analysis

INFOSYS Daily Technical Analysis

FUNCTION: Counter Trend

MODE: Corrective

STRUCTURE: Orange Wave 4

POSITION: Navy Blue Wave A

DIRECTION NEXT LOWER DEGREES: Orange Wave 5

DETAILS: Orange Wave 3 appears completed; Orange Wave 4 is currently unfolding.

Wave Cancel Invalidation Level: 1838

The INFOSYS (NSE: INFY) daily chart highlights a classic Elliott Wave correction in progress, suggesting a temporary bullish retracement within a larger downtrend. With Orange Wave 3 completed, the price is now moving through Orange Wave 4, forming part of Navy Blue Wave A in this counter-trend structure.

Orange Wave 4, a corrective rally, typically retraces 23% to 38% of the previous third wave's decline. This current phase exhibits overlapping price action and reduced momentum, in line with a standard wave 4 development. The correction signals a pause in bearish momentum, often attracting short-term trading opportunities.

Once this correction concludes, a decline into Orange Wave 5 is expected, likely marking the final leg of the broader bearish cycle. The key invalidation level is at 1838—a break above this level would invalidate the current wave structure and require a revised count.

Traders should monitor bearish reversal signals within Wave 4, such as bearish candlestick patterns, overbought oscillators, or Fibonacci resistance levels, to prepare for the anticipated Wave 5 decline. This structure offers a strategic window for trade setups aligned with the broader downtrend.

INFOSYS-INFY-Indian-...


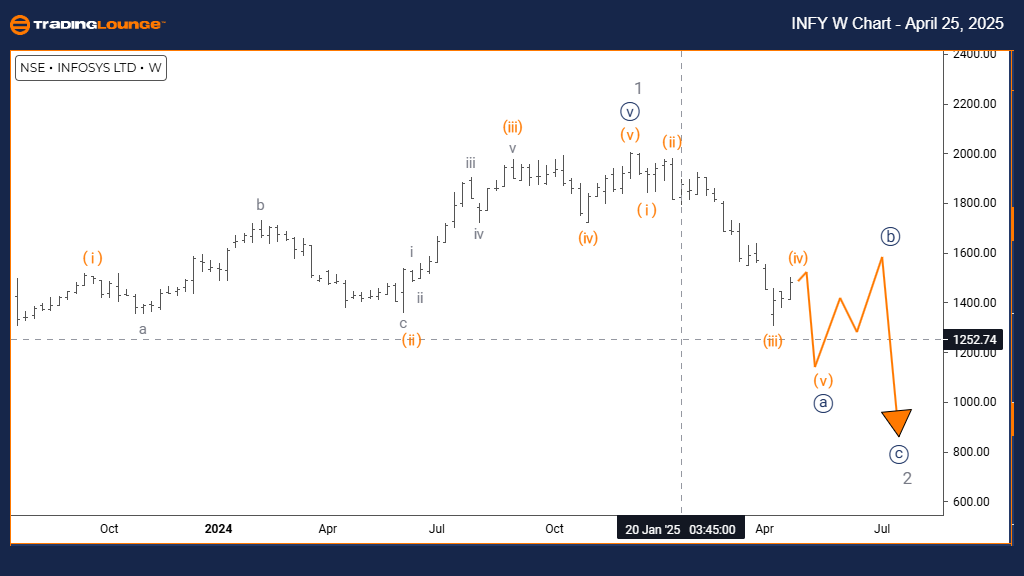
INFOSYS Elliott Wave Analysis – TradingLounge Weekly Chart

INFOSYS Weekly Technical Analysis

FUNCTION: Counter Trend

MODE: Impulsive

STRUCTURE: Navy Blue Wave A

POSITION: Gray Wave 2

DIRECTION NEXT HIGHER DEGREES: Navy Blue Wave B

DETAILS: Gray Wave 1 appears completed; Navy Blue Wave A of Gray Wave 2 is developing.

The INFOSYS (INFY) weekly chart outlines a corrective bounce taking shape after the decline of Gray Wave 1, initiating Navy Blue Wave A—the first leg of Gray Wave 2. This movement fits within a bearish Elliott Wave framework, suggesting a medium-term retracement before the larger downtrend potentially resumes.

Navy Blue Wave A typically begins an ABC correction and represents a relief rally with moderate upward momentum. As Wave 1 ends, Wave A emerges to retrace 38%–61% of the preceding decline. This phase often provides swing trading opportunities within an otherwise bearish context.

The next phase—Navy Blue Wave B—is expected to initiate a counter-move downward, continuing the ABC correction. Traders should anticipate bearish setups as Wave A nears completion and prepare for the potential decline of Wave B.

Monitoring Fibonacci retracement levels, momentum shifts, and volume divergences will be crucial in identifying the transition from Wave A to B. This weekly correction phase is significant, offering technical insights for positioning ahead of the next bearish cycle.

Technical Analyst: Malik Awais

Source: Visit Tradinglounge.com and learn from the Experts. Join TradingLounge Here 

Previous: TCS Elliott Wave Technical Analysis

VALUE Offer - Buy 1 Month & Get 3 Months!Click here

Access 7 Analysts Over 200 Markets Covered. Chat Room With Support

INFOSYS-INFY-Indian-...

Related

Identifies the current wave structure with index market analysis: FTSE 100 (UK) Elliott Wave Technical Analysis

Identifies the current wave structure with index market analysis: FTSE 100 (UK) Elliott Wave Technical Analysis

This article provides an in-depth Elliott Wave analysis of the FTSE 100 market on both daily and wee...

Read More >
UNIBAIL RODAMCO WESTFIELD Stock Analysis & URW Elliott Wave Technical Forecast Make Informed Decisions

UNIBAIL RODAMCO WESTFIELD Stock Analysis & URW Elliott Wave Technical Forecast Make Informed Decisions

Our detailed Elliott Wave analysis of ASX: UNIBAIL-RODAMCO-WESTFIELD (URW) provides insights into cu...

Read More >
S&P/TSX 60 Elliott Wave Analysis Reveals Bullish Impulsive Trends Forecasting Continued Growth in Canadian Stock Market

S&P/TSX 60 Elliott Wave Analysis Reveals Bullish Impulsive Trends Forecasting Continued Growth in Canadian Stock Market

The S&P/TSX 60 index is exhibiting a bullish trend as per Elliott Wave analysis, currently progressi...

Read More >
Our Expert U.S. Dollar/Canadian Dollar Technical Analysis and Forecasts with USDCAD Forex Elliott Wave Technical Analysis

Our Expert U.S. Dollar/Canadian Dollar Technical Analysis and Forecasts with USDCAD Forex Elliott Wave Technical Analysis

Our detailed USDCAD Elliott Wave analysis provides insights into the current market trends, focusing...

Read More >
Actionable Trading Strategies and Key Price Points: BHP GROUP LIMITED - BHP Stock Analysis & Elliott Wave Technical Forecast

Actionable Trading Strategies and Key Price Points: BHP GROUP LIMITED - BHP Stock Analysis & Elliott Wave Technical Forecast

This article provides an in-depth Elliott Wave Analysis of ASX: BHP GROUP LIMITED. We explore curren...

Read More >
Insights into the Current Trends in the ASX Market: ASX LIMITED Stock Analysis & ASX Elliott Wave Technical Forecast

Insights into the Current Trends in the ASX Market: ASX LIMITED Stock Analysis & ASX Elliott Wave Technical Forecast

This article provides an in-depth Elliott Wave analysis of ASX Limited, focusing on its potential pr...

Read More >

$1 for 2 Weeks

then $29 a month!

What a Special Offer!

Trade Recommendations

Unleash the power of deversified trading with our comprehensive portfolio, covering 250+ markets:

  • Stock Trades
  • Crypto Trades
  • Forex Trades
  • Commodity Trades
Elliott Wave Analysis

Gain a competitive edge with expert insights and AI-powered Elliott Wave charting into:

  • Global Indices
  • US Stocks & ASX Stocks
  • Forex & Crypto
  • Commodities
Top-Notch Trading Tools

Equip yourself with the tools of success:

  • Real-time Chat rooms
  • Elliott Wave Algorithm
  • Portfolio tools
  • TradingLevels
  • Screener
  • Trading Game
7 Elliott Wave Analysts

Stay ahead of the market with daily charts and insightful videos
Your secret to strategic trading!

JOIN HERE


Welcome to TradingLounge (ASIC A.R.No. 321187), specialists in trades, trading education and technical analysis, covering stocks, indices, commodities, forex and cryptocurrencies.

When you join TradingLounge you have access to everything we offer, including trade tools, educational content and a social platform to chat with like-minded investors.

Read more

@Copyright 2024 by tradinglounge.com

Contact Us

Australian no: 02 4787 6020

International no: +61 (2) 47876020

Pay with:

Find us on