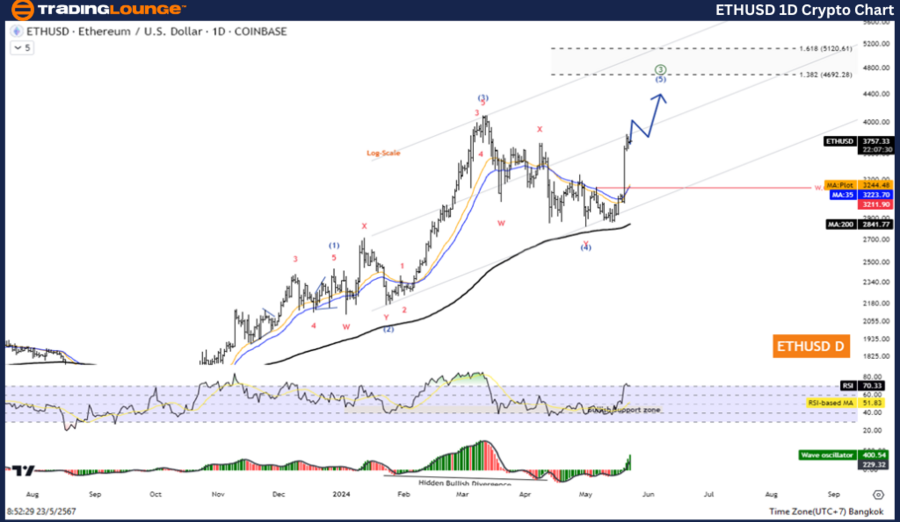
Elliott Wave Analysis TradingLounge Daily Chart

Ethereum/ U.S. Dollar (ETHUSD) Daily Chart Analysis

ETHUSD Elliott Wave Technical Analysis

Function: Follow Trend

Mode: Motive

Structure: Impulse

Position: Wave 5

Direction Next Higher Degrees: Wave 5 of Wave (3)

Wave Cancel Invalid Level: N/A

Details: Wave (5) trend move to test 4692.28

Ethereum/ U.S. Dollar (ETHUSD) Trading Strategy:

The wave 4 correction appears to have concluded, and the price has risen in Wave 5. We will now focus on a five-wave increase within the Impulse pattern, potentially testing levels between 4692 and 5120.

Ethereum/ U.S. Dollar (ETHUSD) Technical Indicators

  • The price is above the MA200, indicating an uptrend.
  • The Wave Oscillator shows bullish momentum.

In the context of Elliott Wave Theory, Ethereum (ETHUSD) demonstrates a clear trend. Analyzing the daily chart, we observe a motive mode impulse structure currently positioned in Wave 5. This aligns with the broader direction of Wave 5 within Wave (3), suggesting an ongoing upward movement.

ETHUSD-1D-crypto-cha...


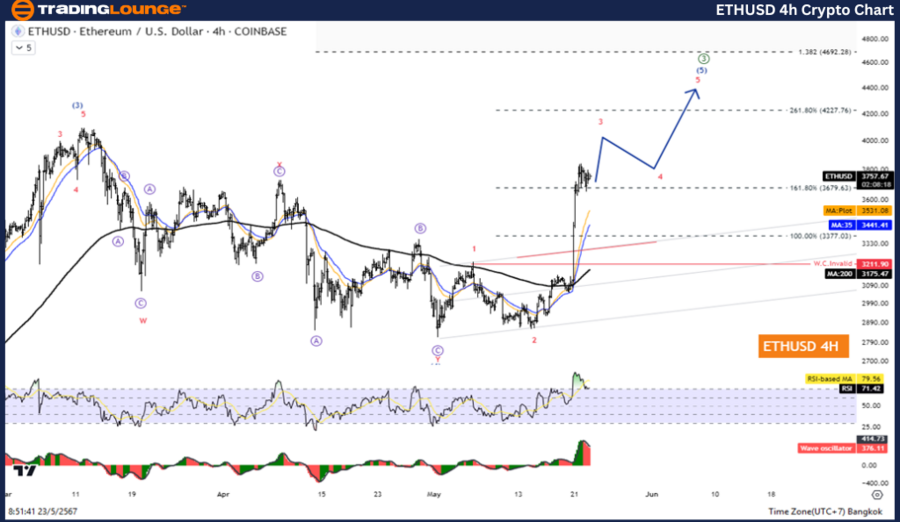
ETHUSD Elliott Wave Analysis TradingLounge H4 Chart

Ethereum/ U.S. Dollar (ETHUSD) 4-Hour Chart Analysis

ETHUSD Elliott Wave Technical Analysis

Function: Follow Trend

Mode: Motive

Structure: Impulse

Position: Wave (3)

Direction Next Higher Degrees: Wave (3) of ((3))

Wave Cancel Invalid Level: N/A

Details: Wave (3) is equal to 261.8% of Wave (1) at 4227.76

Ethereum/ U.S. Dollar (ETHUSD) Trading Strategy

The wave 4 correction seems to have ended, and the price has risen in Wave 5. We will concentrate on a five-wave increase within the Impulse pattern, likely testing levels between 4692 and 5120.

Ethereum/ U.S. Dollar (ETHUSD) Technical Indicators

  • The price is above the MA200, indicating an uptrend.
  • The Wave Oscillator shows bullish momentum.

Moving to the H4 chart, the Elliott Wave analysis presents a consistent picture. Here, we see Ethereum in Wave (3) within a larger Wave ((3)), maintaining the motive mode and impulse structure. Specifically, Wave (3) has reached 261.8% of Wave (1) at 4227.76, a significant Fibonacci extension level often associated with strong price movements.

Technical Analyst:  Kittiampon Somboonsod

Source: visit Tradinglounge.com and learn From the Experts Join TradingLounge Here 

See Previous: Dogecoin/USD (DOGEUSD) Elliott Wave Technical Analysis

Special Trial Offer - 0.76 Cents a Day for 3 Months! Click here

Access 7 Analysts Over 170 Markets Covered. Chat Room With Support

ETHUSD-4hr-crypto-ch...

Related

DJI Elliott Wave Technical Analysis: Dow Jones Index Market Analysis signals a bullish trend, with Wave Driving Upward Momentum

DJI Elliott Wave Technical Analysis: Dow Jones Index Market Analysis signals a bullish trend, with Wave Driving Upward Momentum

The Dow Jones Elliott Wave analysis signals a bullish trend, with Orange Wave 3 and Navy Blue Wave 5...

Read More >
U.S. Dollar / Canadian Dollar Forex Pair - Elliott Wave Technical USDCAD Analysis Offers Valuable Insights for your Trading Strategy

U.S. Dollar / Canadian Dollar Forex Pair - Elliott Wave Technical USDCAD Analysis Offers Valuable Insights for your Trading Strategy

This article provides an in-depth analysis of USDCAD using the Elliott Wave theory. It covers both i...

Read More >
Bajaj Finserv Elliott Wave Technical Analysis for Daily and Weekly Charts | Stock Forecast, and Trading Strategy Insights

Bajaj Finserv Elliott Wave Technical Analysis for Daily and Weekly Charts | Stock Forecast, and Trading Strategy Insights

Elliott Wave analysis of Bajaj Finserv, highlighting daily and weekly chart patterns. It covers the ...

Read More >
Wheat Commodity Elliott Wave Technical Analysis: Bullish Corrections and Future Price Movements in Wheat Futures

Wheat Commodity Elliott Wave Technical Analysis: Bullish Corrections and Future Price Movements in Wheat Futures

Our latest wheat price forecast for 2024 is based on Elliott Wave analysis, highlighting key market ...

Read More >
SPDR Financial Sector ETF (XLF) Elliott Wave Forecast: Bullish Impulse Wave, Support Levels, and Price Target Above $54 for ETF Traders

SPDR Financial Sector ETF (XLF) Elliott Wave Forecast: Bullish Impulse Wave, Support Levels, and Price Target Above $54 for ETF Traders

This analysis breaks down the current Elliott Wave structure of the SPDR Financial Sector ETF (XLF),...

Read More >

$1 for 2 Weeks

then $29 a month!

What a Special Offer!

Trade Recommendations

Unleash the power of deversified trading with our comprehensive portfolio, covering 250+ markets:

  • Stock Trades
  • Crypto Trades
  • Forex Trades
  • Commodity Trades
Elliott Wave Analysis

Gain a competitive edge with expert insights and AI-powered Elliott Wave charting into:

  • Global Indices
  • US Stocks & ASX Stocks
  • Forex & Crypto
  • Commodities
Top-Notch Trading Tools

Equip yourself with the tools of success:

  • Real-time Chat rooms
  • Elliott Wave Algorithm
  • Portfolio tools
  • TradingLevels
  • Screener
  • Trading Game
7 Elliott Wave Analysts

Stay ahead of the market with daily charts and insightful videos
Your secret to strategic trading!

JOIN HERE


Welcome to TradingLounge (ASIC A.R.No. 321187), specialists in trades, trading education and technical analysis, covering stocks, indices, commodities, forex and cryptocurrencies.

When you join TradingLounge you have access to everything we offer, including trade tools, educational content and a social platform to chat with like-minded investors.

Read more

@Copyright 2024 by tradinglounge.com

Contact Us

Australian no: 02 4787 6020

International no: +61 (2) 47876020

Pay with:

Find us on