NEOUSD Elliott Wave Analysis – TradingLounge Daily Chart)
NEO/ U.S. Dollar (NEOUSD) Daily Chart Analysis
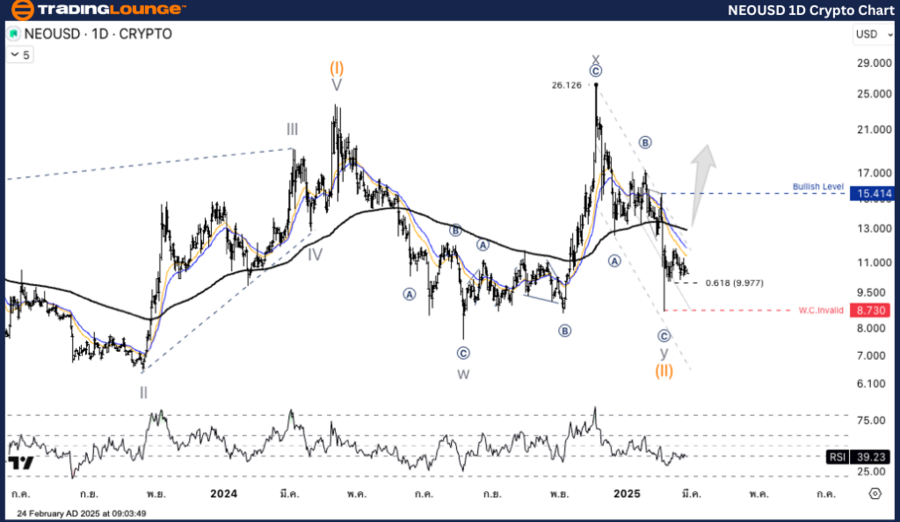
NEO/USD Elliott Wave Technical Analysis
- Function: Counter Trend
- Mode: Corrective
- Structure: Zigzag
- Position: Wave ((C))
- Next Higher Degree Direction: Wave Y
- Wave Cancel Invalid Level: Not applicable
- Analysis Details: The correction follows a WXY pattern, concluding around 8.688 USD, signaling a potential turning point.
NEO/USD Trading Strategy – Daily Chart
NEO/USD is currently undergoing a corrective Wave II phase, following the completion of Impulse Wave I, which peaked at 26.126 USD. The corrective movement is forming a W-X-Y (Double Zigzag) structure, indicating a complex corrective wave pattern.
Trading Strategy
✅ Long Entry Strategy:
- Monitor for a reversal signal near 9.977 USD before considering a buy position.
✅ Risk Management:
- Set a Stop Loss at 8.730 USD to mitigate downside risk.
NEOUSD Elliott Wave Analysis – TradingLounge H4 Chart
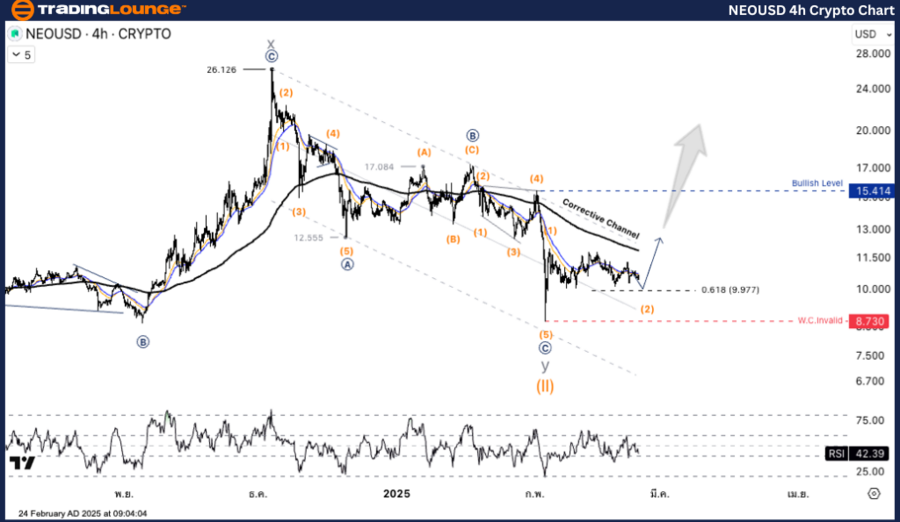
NEO/USD Elliott Wave Technical Analysis (H4 Chart)
- Function: Counter Trend
- Mode: Corrective
- Structure: Zigzag
- Position: Wave ((C))
- Next Higher Degree Direction: Wave Y
- Wave Cancel Invalid Level: Not applicable
- Analysis Details: The corrective phase maintains a WXY pattern, bottoming around 8.688 USD, reinforcing the possibility of a trend shift.
NEO/USD Trading Strategy – H4 Chart
Similar to the Daily Chart analysis, NEO/USD remains in Wave II correction, having completed Impulse Wave I at 26.126 USD. The market is forming a W-X-Y (Double Zigzag) pattern, confirming an extended corrective structure.
Trading Strategy
✅ Long Entry Strategy:
✅ Risk Management:
- Maintain Stop Loss at 8.730 USD to protect against further declines.
Technical Analyst: Kittiampon Somboonsod
Source: visit Tradinglounge.com and learn From the Experts Join TradingLounge Here
Previous: BTCUSD Elliott Wave Technical Analysis
VALUE Offer - Buy 1 Month & Get 3 Months!Click here
Access 7 Analysts Over 200 Markets Covered. Chat Room With Support
Conclusion & Key Insights