20Mar

Bharat Electronics Elliott Wave Analysis: Stock Forecast, Market Trends, and Price Prediction Using Elliott Wave Theory

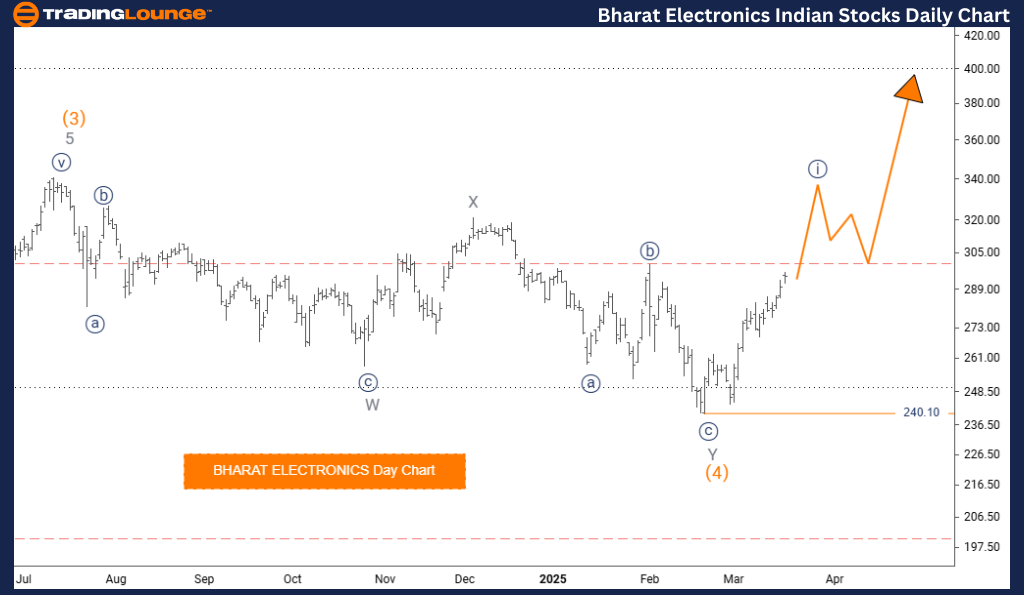
Bharat Electronics Elliott Wave Analysis – Trading Lounge Daily Chart

Bharat Electronics Elliott Wave Technical Analysis

Function: Bullish Trend

Mode: Impulsive

Structure: Navy Blue Wave 1

Position: Gray Wave 1

Next Lower Degree Direction: Navy Blue Wave 2

Wave Cancellation Level: 240.10

Analysis Details

The Bharat Electronics Elliott Wave Analysis on the daily chart confirms a bullish trend, with the market currently in an impulsive phase, showcasing strong upward momentum.

  • The primary wave structure under observation is Navy Blue Wave 1, forming part of a larger wave cycle.
  • This Navy Blue Wave 1 is positioned within Gray Wave 1, validating its placement in the broader Elliott Wave framework.
  • The previous corrective phase (Orange Wave 4) appears to be completed, enabling the market to transition into Navy Blue Wave 1 of Gray Wave 1.
  • This phase marks the beginning of a new upward movement, signaling further gains before an anticipated corrective phase in Navy Blue Wave 2.
  • A critical invalidation point is set at 240.10—if the price falls below this level, the current wave structure becomes invalid, necessitating a reassessment of trading strategies.

Trading Considerations

  • Traders should monitor key price levels and prepare for potential corrections once Navy Blue Wave 1 completes.
  • The bullish wave structure aligns with the broader Elliott Wave pattern, reinforcing expectations of continued market growth.
  • Observing price movements and wave progressions will assist traders in making strategic, data-driven decisions based on prevailing market conditions.

Bharat-Electronics-d...


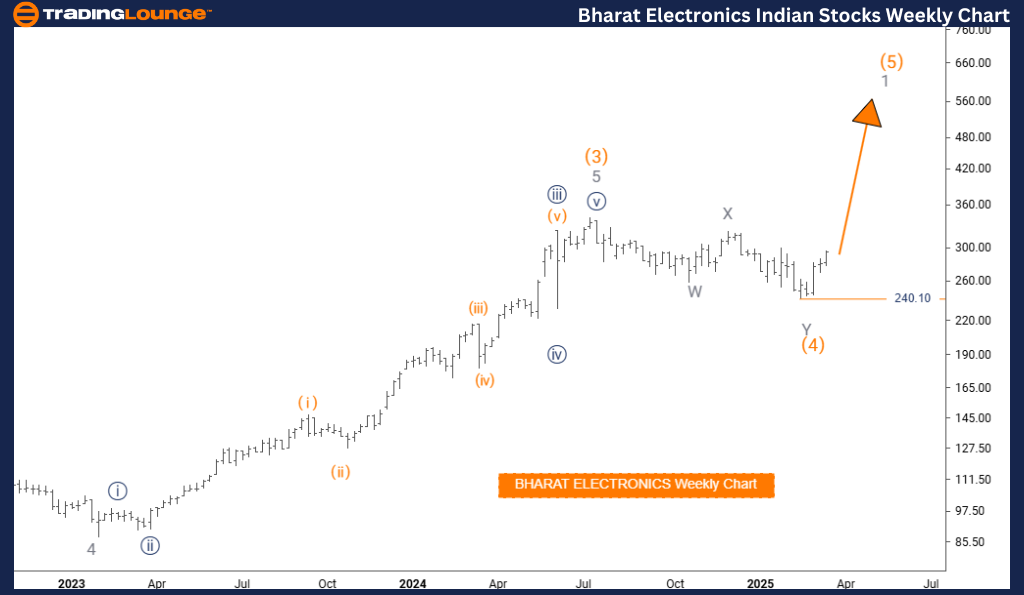
Bharat Electronics Elliott Wave Analysis – Trading Lounge Weekly Chart

Bharat Electronics Elliott Wave Technical Analysis

Function: Bullish Trend

Mode: Impulsive

Structure: Gray Wave 1

Position: Orange Wave 5

Next Higher Degree Direction: Gray Wave 1

Wave Cancellation Level: 240.10

Analysis Details

The Bharat Electronics Elliott Wave Analysis on the weekly chart reflects a bullish trend, with the market currently in an impulsive phase, exhibiting strong upward momentum.

  • The primary wave structure in focus is Gray Wave 1, forming part of a larger wave cycle.
  • This Gray Wave 1 is positioned within Orange Wave 5, confirming its placement in the broader Elliott Wave structure.
  • The previous corrective phase (Orange Wave 4) appears completed, allowing the market to advance into Gray Wave 1 of Wave 5.
  • This phase signifies the beginning of a new upward trend, suggesting potential gains before an expected corrective phase in lower-degree waves.
  • A key invalidation level is set at 240.10—if the price drops below this threshold, the current wave structure will be invalidated, requiring traders to reassess their market approach.

Trading Considerations

  • Traders should keep an eye on critical price levels and anticipate possible corrections upon the completion of Gray Wave 1.
  • The bullish wave formation is consistent with the broader Elliott Wave pattern, supporting the expectation of sustained market growth.
  • By closely tracking price fluctuations and wave progressions, traders can make well-informed trading decisions in line with current market conditions.

Technical Analyst: Malik Awais

Source: visit Tradinglounge.com and learn From the Experts Join TradingLounge Here 

Previous:Mahindra & Mahindra Elliott Wave Technical Analysis

VALUE Offer - Buy 1 Month & Get 3 Months!Click here

Access 7 Analysts Over 200 Markets Covered. Chat Room With Support

Bharat-Electronics-w...

Related

EURUSD Elliott Wave Overview: Daily Wave 3 Upside and 4H Micro Wave 2 Pullback Signals Resumption with Fibonacci Entry Opportunities

EURUSD Elliott Wave Overview: Daily Wave 3 Upside and 4H Micro Wave 2 Pullback Signals Resumption with Fibonacci Entry Opportunities

Detailed Elliott Wave breakdown for EURUSD shows a strong bullish trend on the daily chart within gr...

Read More >
ASX:IAG Elliott Wave Analysis, Stock Forecast, Price Trends, Wave Patterns, Market Insights, and Trading Strategies for Investors

ASX:IAG Elliott Wave Analysis, Stock Forecast, Price Trends, Wave Patterns, Market Insights, and Trading Strategies for Investors

Get the latest ASX:IAG Elliott Wave analysis and stock forecast. Learn how wave patterns influence I...

Read More >
XRP Crypto Price News Today Elliott Wave Technical Analysis: Predicting Price Movements and Strategies

XRP Crypto Price News Today Elliott Wave Technical Analysis: Predicting Price Movements and Strategies

Gain insights into XRP/USD with our Elliott Wave analysis. Learn about XRP price predictions, tradin...

Read More >
Cocoa Elliott Wave Analysis: Forecasting Price Correction, Bullish Trend, and Trading Strategies for Cocoa Futures and Investments

Cocoa Elliott Wave Analysis: Forecasting Price Correction, Bullish Trend, and Trading Strategies for Cocoa Futures and Investments

Cocoa prices are correcting after a record high, with a bullish long-term trend expected. Get a full...

Read More >
Understanding Daily and 4Hr Chart Trends: UnitedHealth Group Inc. (UNH) Elliott Wave Technical Analysis

Understanding Daily and 4Hr Chart Trends: UnitedHealth Group Inc. (UNH) Elliott Wave Technical Analysis

UnitedHealth Group Inc. (UNH) presents intriguing opportunities for traders amidst its ongoing corre...

Read More >
Unlocking ASX Trading Success: REECE LIMITED - REH Stock Analysis & Elliott Wave Technical Forecast

Unlocking ASX Trading Success: REECE LIMITED - REH Stock Analysis & Elliott Wave Technical Forecast

This article provides an in-depth Elliott Wave technical analysis of Reece Limited (ASX: REH), offer...

Read More >

$1 for 2 Weeks

then $29 a month!

What a Special Offer!

Trade Recommendations

Unleash the power of deversified trading with our comprehensive portfolio, covering 250+ markets:

  • Stock Trades
  • Crypto Trades
  • Forex Trades
  • Commodity Trades
Elliott Wave Analysis

Gain a competitive edge with expert insights and AI-powered Elliott Wave charting into:

  • Global Indices
  • US Stocks & ASX Stocks
  • Forex & Crypto
  • Commodities
Top-Notch Trading Tools

Equip yourself with the tools of success:

  • Real-time Chat rooms
  • Elliott Wave Algorithm
  • Portfolio tools
  • TradingLevels
  • Screener
  • Trading Game
7 Elliott Wave Analysts

Stay ahead of the market with daily charts and insightful videos
Your secret to strategic trading!

JOIN HERE


Welcome to TradingLounge (ASIC A.R.No. 321187), specialists in trades, trading education and technical analysis, covering stocks, indices, commodities, forex and cryptocurrencies.

When you join TradingLounge you have access to everything we offer, including trade tools, educational content and a social platform to chat with like-minded investors.

Read more

@Copyright 2024 by tradinglounge.com

Contact Us

Australian no: 02 4787 6020

International no: +61 (2) 47876020

Pay with:

Find us on