GX Uranium ETF Commodity Elliott Wave Technical Analysis

The GX URA ETF, also known as the Global X Uranium ETF, tracks the performance of companies in the uranium industry. This ETF offers investors a diversified portfolio that includes firms involved in uranium mining, exploration, and production worldwide. As nuclear power gains recognition as a cleaner energy alternative, the demand for uranium is expected to rise, making the GX URA ETF an attractive option for investors looking to benefit from the sector's growth.

GX URA ETF Elliott Wave Technical Analysis

The GX URA ETF has resumed its downward trajectory, continuing the sell-off that started from its peak in May 2024. The recent decline suggests a bearish impulse wave structure is forming, indicating further downside movement is likely in the coming weeks.

Daily Chart Analysis

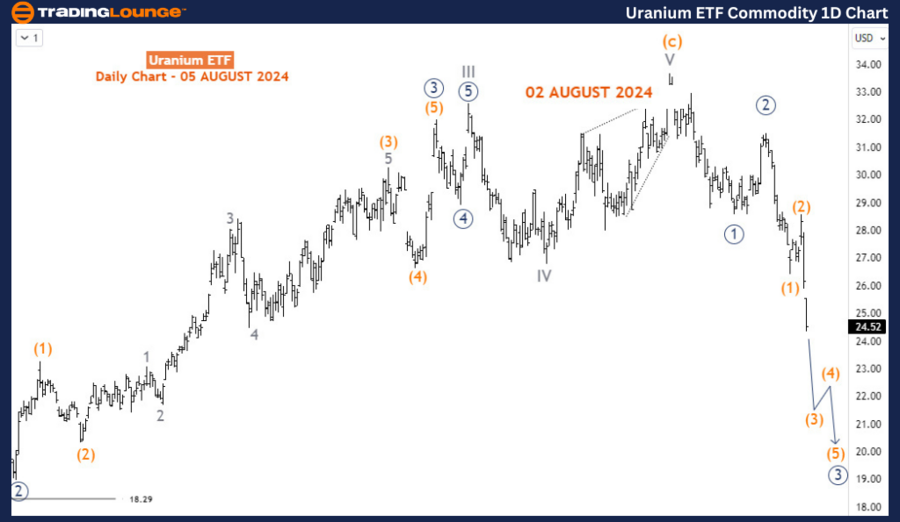
On the daily chart, the bullish corrective cycle that began in March 2020 concluded on May 21, 2024. During this cycle, the supercycle waves (a)-(b)-(c) unfolded, with wave (a) completing as an impulse wave in November 2021. This was followed by a wave (b) pullback, which ended as a double zigzag in July 2022 at 17.70. From the July 2022 low, a bullish impulse wave commenced, culminating at the May 2024 peak.

From this peak, we are likely to witness either a full bearish impulse wave sequence (1-2-3-4-5) or an A-B-C corrective decline of the cycle degree. The price is currently in wave (3) of 3 (circled) of either a or I, suggesting that wave (3) could extend lower toward the 21.58-20.39 range in the coming weeks.
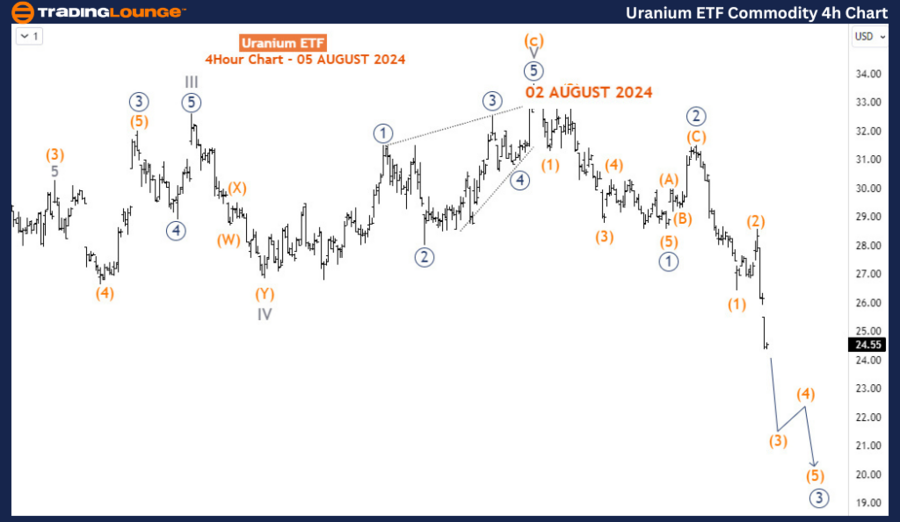
Uranium-ETF-Commodit...


H4 Chart Analysis

The H4 chart aligns with the daily chart's outlook, reinforcing the expectation that wave (3) will continue to push lower. Sellers are in control of this ETF, and the bearish momentum is likely to persist, driving prices further down.

Conclusion

In summary, the GX URA ETF is amid a significant sell-off, driven by a developing bearish impulse wave structure. With the potential for wave (3) to extend lower, traders should expect continued downward pressure on this ETF. The outlook remains bearish, and selling opportunities may arise as the market progresses toward key support levels.

Technical Analyst: Sanmi Adeagbo

Source: visit Tradinglounge.com and learn From the Experts Join TradingLounge Here 

See Previous: Gold Elliott Wave Technical Analysis

Special Trial Offer - 0.76 Cents a Day for 3 Months! Click here

Access 7 Analysts Over 170 Markets Covered. Chat Room With Support

Uranium-ETF-Commodit...

Related

NEO’s Crypto Market Trends with Accurate Forecasts and Actionable Plans: NEOUSD Elliott Wave Technical Analysis

NEO’s Crypto Market Trends with Accurate Forecasts and Actionable Plans: NEOUSD Elliott Wave Technical Analysis

This analysis provides an in-depth look at NEOUSD using Elliott Wave theory, offering key insights i...

Read More >
Unlock Euro/ U.S. Dollar (EURUSD) Elliott Wave Technical Analysis: Daily Chart Insights and Forex Trading Strategies

Unlock Euro/ U.S. Dollar (EURUSD) Elliott Wave Technical Analysis: Daily Chart Insights and Forex Trading Strategies

This in-depth EURUSD Elliott Wave analysis provides a clear overview of the daily and 4-hour chart t...

Read More >
Ethereum/ U.S. dollar(ETHUSD) Elliott Wave Technical Analysis 15 November 23

Ethereum/ U.S. dollar(ETHUSD) Elliott Wave Technical Analysis 15 November 23

Ethereum/ U.S. dollar(ETHUSD) Elliott Wave Technical Analysis on 15 November 23 with daily chart.

Read More >
NIKKEI 225 (N225) Elliott Wave Analysis: Bullish Trend, Orange Wave 1 and Navy Blue Wave 3 with Risk Management Insights.

NIKKEI 225 (N225) Elliott Wave Analysis: Bullish Trend, Orange Wave 1 and Navy Blue Wave 3 with Risk Management Insights.

A comprehensive breakdown of the NIKKEI 225 Elliott Wave structure for daily and weekly charts. The ...

Read More >
Corn's Bearish Trend and Future Movements in the Commodity Market - Corn Elliott Wave Technical Analysis

Corn's Bearish Trend and Future Movements in the Commodity Market - Corn Elliott Wave Technical Analysis

This detailed analysis of corn prices leverages the Elliott Wave theory to forecast market trends. E...

Read More >

$1 for 2 Weeks

then $29 a month!

What a Special Offer!

Trade Recommendations

Unleash the power of deversified trading with our comprehensive portfolio, covering 250+ markets:

  • Stock Trades
  • Crypto Trades
  • Forex Trades
  • Commodity Trades
Elliott Wave Analysis

Gain a competitive edge with expert insights and AI-powered Elliott Wave charting into:

  • Global Indices
  • US Stocks & ASX Stocks
  • Forex & Crypto
  • Commodities
Top-Notch Trading Tools

Equip yourself with the tools of success:

  • Real-time Chat rooms
  • Elliott Wave Algorithm
  • Portfolio tools
  • TradingLevels
  • Screener
  • Trading Game
7 Elliott Wave Analysts

Stay ahead of the market with daily charts and insightful videos
Your secret to strategic trading!

JOIN HERE


Welcome to TradingLounge (ASIC A.R.No. 321187), specialists in trades, trading education and technical analysis, covering stocks, indices, commodities, forex and cryptocurrencies.

When you join TradingLounge you have access to everything we offer, including trade tools, educational content and a social platform to chat with like-minded investors.

Read more

@Copyright 2024 by tradinglounge.com

Contact Us

Australian no: 02 4787 6020

International no: +61 (2) 47876020

Pay with:

Find us on