TreadingLounge Corn Commodity Elliott Wave Analysis

Corn Elliott Wave Technical Analysis

Corn prices have surged over 13% since the low on August 26th, following a correction after the August 28th contract shift. Despite this recent rise, the long-term outlook remains bearish, especially if the recovery fails to breach the key $478 resistance level.

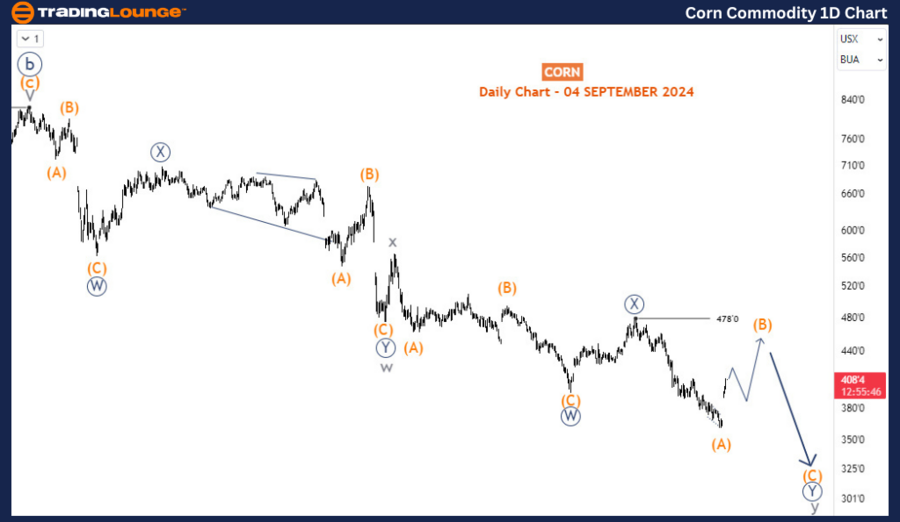
Corn Daily Chart Analysis:

The ongoing bearish trend in corn prices began in April 2022. However, the downward movement appears to be corrective rather than impulsive. Unless an impulsive recovery develops, the current bounce is expected to be temporary, with a likely continuation of the decline. The structure from the April 2022 high resembles a double zigzag pattern at the cycle degree. The drop from the $478 level seems to be an impulse wave, likely forming wave (A) of Y (circled) within the cycle degree wave y. The current recovery is labeled as wave (B) of Y (circled), and it is expected to conclude below $478 to maintain the present Elliott Wave count. In any case, the bounce is anticipated to extend higher in the short term, supported by H4 chart analysis.

Corn-Commodity-1D-Ch...


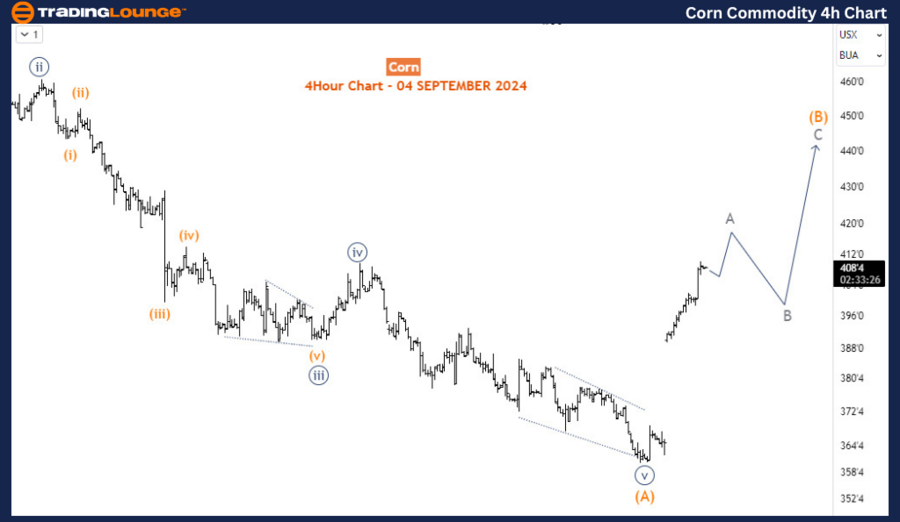
Corn H4 Chart Analysis:

On the H4 chart, the recent rally in corn prices is forming an impulse wave sequence, likely representing wave A of (B). After this wave, a pullback for wave B is expected, followed by another rally to complete wave C of (B). While the short-term outlook favors a corrective bounce, the broader bearish corrective sequence remains incomplete, suggesting the long-term downward trend can resume from the top of (B).

Technical Analyst: Sanmi Adeagbo

Source: visit Tradinglounge.com and learn From the Experts Join TradingLounge Here 

See Previous: Soybean Elliott Wave Technical Analysis

Special Trial Offer - 0.76 Cents a Day for 3 Months! Click here

Access 7 Analysts Over 200 Markets Covered. Chat Room With Support

Corn-Commodity-4h-Ch...

Related

Bitcoin / U.S. dollar(BTCUSD) Elliott Wave Technical Analysis 21 November 23

Bitcoin / U.S. dollar(BTCUSD) Elliott Wave Technical Analysis 21 November 23

Bitcoin/U.S. dollar(BTCUSD) Elliott Wave Technical Analysis on 21 November 23 with BTCUSD Analysis D...

Read More >
S&P BSE SENSEX NEXT 50 Elliott Wave Technical Analysis Reveals Bullish Wave 3 Trend in Indian Stock Market Chart Forecast

S&P BSE SENSEX NEXT 50 Elliott Wave Technical Analysis Reveals Bullish Wave 3 Trend in Indian Stock Market Chart Forecast

Elliott Wave analysis shows a strong bullish structure for the S&P BSE SENSEX NEXT 50 index, with wa...

Read More >
Examines the Lululemon athletica Inc. Stock's Current Trend Structure and Price Forecasts based on Elliott Wave Technical Analysis

Examines the Lululemon athletica Inc. Stock's Current Trend Structure and Price Forecasts based on Elliott Wave Technical Analysis

This comprehensive Elliott Wave analysis of Lululemon Athletica Inc. (LULU) examines the stock's...

Read More >
Texas Instruments Inc.(TXN:NASDAQ) Elliott Wave Technical Analysis 8 December 23

Texas Instruments Inc.(TXN:NASDAQ) Elliott Wave Technical Analysis 8 December 23

Texas Instruments Inc.(TXN: NASDAQ) Elliott Wave Technical Analysis with 4-Hour and 1-hour Chart dat...

Read More >
ASX Commonwealth Bank of Australia (CBA) Stock Movements with Short-term and Long-term Insights: Elliott Wave Analysis

ASX Commonwealth Bank of Australia (CBA) Stock Movements with Short-term and Long-term Insights: Elliott Wave Analysis

This detailed analysis of Commonwealth Bank of Australia (CBA) focuses on Elliott Wave theory to pro...

Read More >
NIKKEI 225 (N225) Elliott Wave Analysis: Bullish Trend, Orange Wave 1 and Navy Blue Wave 3 with Risk Management Insights.

NIKKEI 225 (N225) Elliott Wave Analysis: Bullish Trend, Orange Wave 1 and Navy Blue Wave 3 with Risk Management Insights.

A comprehensive breakdown of the NIKKEI 225 Elliott Wave structure for daily and weekly charts. The ...

Read More >

$1 for 2 Weeks

then $29 a month!

What a Special Offer!

Trade Recommendations

Unleash the power of deversified trading with our comprehensive portfolio, covering 250+ markets:

  • Stock Trades
  • Crypto Trades
  • Forex Trades
  • Commodity Trades
Elliott Wave Analysis

Gain a competitive edge with expert insights and AI-powered Elliott Wave charting into:

  • Global Indices
  • US Stocks & ASX Stocks
  • Forex & Crypto
  • Commodities
Top-Notch Trading Tools

Equip yourself with the tools of success:

  • Real-time Chat rooms
  • Elliott Wave Algorithm
  • Portfolio tools
  • TradingLevels
  • Screener
  • Trading Game
7 Elliott Wave Analysts

Stay ahead of the market with daily charts and insightful videos
Your secret to strategic trading!

JOIN HERE


Welcome to TradingLounge (ASIC A.R.No. 321187), specialists in trades, trading education and technical analysis, covering stocks, indices, commodities, forex and cryptocurrencies.

When you join TradingLounge you have access to everything we offer, including trade tools, educational content and a social platform to chat with like-minded investors.

Read more

@Copyright 2024 by tradinglounge.com

Contact Us

Australian no: 02 4787 6020

International no: +61 (2) 47876020

Pay with:

Find us on