03Sep

Soybean Commodity Elliott Wave Technical Analysis: Ongoing Bearish Trend, Potential Price Movements, and Strategic Insights

Soybean Commodity Elliott Wave Analysis

The long-term bearish trend for soybeans, initiated in June 2022, continues to exert downward pressure on prices, which are now hovering near a four-year low. The ongoing downtrend shows no indication of a significant reversal, and investors are likely to keep selling during rallies until a clear bottom is established. From a technical standpoint, there have been no strong reversal signals, suggesting the bearish trend may persist.

Soybean Elliott Wave Analysis

Long-Term Perspective

Prior to the June 2022 decline, soybeans experienced a bullish impulse wave that began in May 2019, driving prices up from $806. However, in the past 26 months, more than two-thirds of those gains have been erased. From an Elliott Wave perspective, the current corrective phase appears to be developing into a three-wave pattern, a structure commonly seen in corrective waves.

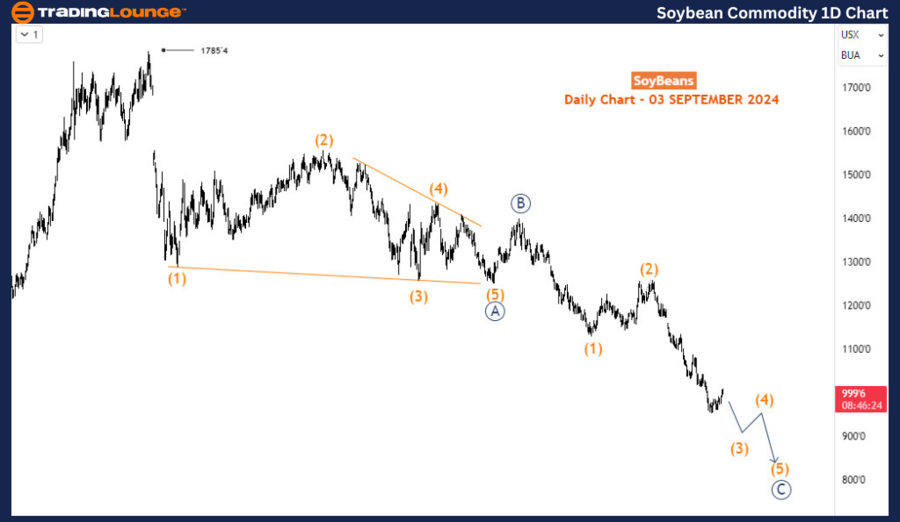
Soybean Daily Chart Analysis

In the daily chart, the corrective pattern is analyzed from the primary wave degree (circled). Wave A (circled) concluded at $1,249 in October 2023, followed by Wave B (circled), which ended at $1,398 in November 2023. Currently, Wave C (circled) is unfolding to the downside. Within this wave, sub-waves (1) and (2) of 5 (circled) have been completed, and the price is now progressing in Wave (3). The price has broken below the key $1,000 level and could potentially decline to $800 before Wave (3) concludes. This movement is part of Wave 5 of (3), indicating that the bearish phase is ongoing. In the short term, additional downward pressure is anticipated.

Soybean-Commodity-1D...


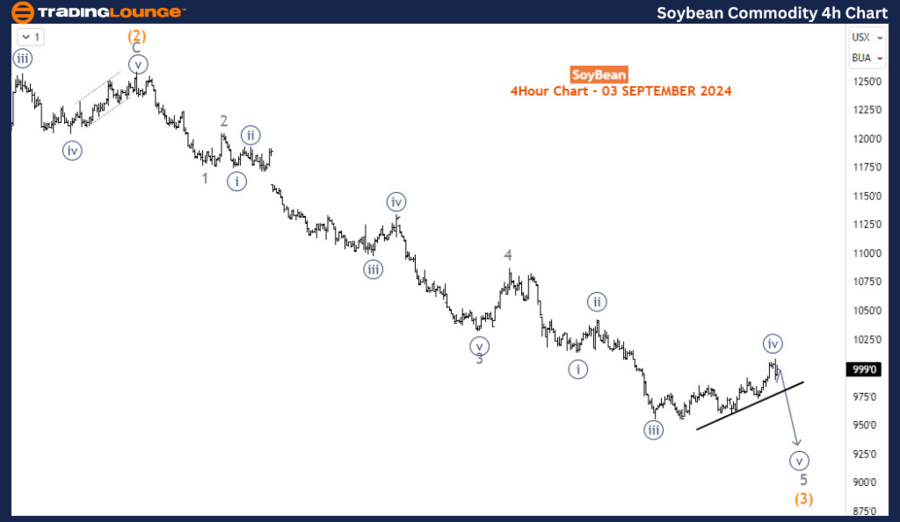
Soybean 4-Hour Chart Analysis

On the H4 chart, Wave 5 is experiencing a temporary bounce in the 4th sub-wave, labeled as Wave iv (circled) of 5. This suggests that after this brief upward correction, soybeans are likely to resume their downward trend, continuing the sell-off. The broader bearish trend remains intact, with further declines expected as the market completes its ongoing corrective phase.

Technical Analyst: Sanmi Adeagbo

Source: visit Tradinglounge.com and learn From the Experts Join TradingLounge Here 

See Previous: Iron Ore Elliott Wave Technical Analysis

Special Trial Offer - 0.76 Cents a Day for 3 Months! Click here

Access 7 Analysts Over 200 Markets Covered. Chat Room With Support

Soybean-Commodity-4H...

Related

S&P/TSX 60 Elliott Wave Technical  Analysis: Market Trends, Corrective Wave Structure, Stock Forecast, Trading Strategy

S&P/TSX 60 Elliott Wave Technical Analysis: Market Trends, Corrective Wave Structure, Stock Forecast, Trading Strategy

Elliott Wave Analysis of the S&P/TSX 60 index, covering key aspects such as counter-trend movements,...

Read More >
Australian Dollar/Japanese Yen (AUDJPY) Through Market Trends - Forex Elliott Wave Technical Analysis

Australian Dollar/Japanese Yen (AUDJPY) Through Market Trends - Forex Elliott Wave Technical Analysis

This detailed article provides an in-depth Elliott Wave Analysis of the AUDJPY (Australian Dollar/Ja...

Read More >
WTI Crudeoil Elliott Wave Analysis: Crude Oil Price Forecast, Support & Resistance Levels, and Trading Strategy Insights

WTI Crudeoil Elliott Wave Analysis: Crude Oil Price Forecast, Support & Resistance Levels, and Trading Strategy Insights

WTI Elliott Wave analysis of crude oil price trends and potential movements based on technical chart...

Read More >
Hindalco Industries Stock Forecast: Unlock Key Market Insights with Hindalco Stocks Elliott Wave Technical Analysis

Hindalco Industries Stock Forecast: Unlock Key Market Insights with Hindalco Stocks Elliott Wave Technical Analysis

This article provides an in-depth Elliott Wave analysis of Hindalco Industries, including detailed t...

Read More >
Elliott Wave Analysis for NASDAQ Tech Stocks and SP500: Navigating the Correction Phase

Elliott Wave Analysis for NASDAQ Tech Stocks and SP500: Navigating the Correction Phase

NASDAQ 100 (NDX) and SP500 (SPX) are currently in an intermediate or primary wave four, marking the ...

Read More >
Gold (XAUUSD) Commodity Elliott Wave Technical Analysis: Find Out what to Expect From the Next Pullback and How to Navigate

Gold (XAUUSD) Commodity Elliott Wave Technical Analysis: Find Out what to Expect From the Next Pullback and How to Navigate

This analysis dives into Gold's Elliott Wave structure, examining both daily and H4 chart patter...

Read More >

Buy 1 Month

Get 3 Months!

Special Offer:

Trade Recommendations

Unleash the power of deversified trading with our comprehensive portfolio, covering:

  • Stock Trades
  • Crypto Trades
  • Forex Trades
  • Commodity Trades
Elliott Wave Analysis

Gain a competive edge with expert insights in to:

  • Global Indices
  • US Stocks & ASX Stocks
  • Forex & Crypto
  • Commodities
Top-Notch Trading Tools

Equip yourself with the tools of success:

  • Social Chat
  • Elliott Wave Algorithm
  • Screener
  • TradingLevels
  • Trading Game
7 Elliott Wave Analysts

Stay ahead of the market with daily charts and insightful videos
-Your secret to strategic trading!

JOIN HERE


Welcome to TradingLounge (ASIC A.R.No. 321187), specialists in trades, trading education and technical analysis, covering stocks, indices, commodities, forex and cryptocurrencies.

When you join TradingLounge you have access to everything we offer, including trade tools, educational content and a social platform to chat with like-minded investors.

Read more

@Copyright 2024 by tradinglounge.com

Contact Us

Australian no: 02 4787 6020

International no: +61 (2) 47876020

Pay with:

Find us on