01Feb

S&P/TSX 60 Index Elliott Wave Analysis: Market Trends, Forecast, Market Movements with this Comprehensive Technical Analysis

S&P/TSX 60 Elliott Wave Analysis – TradingLounge Daily Chart

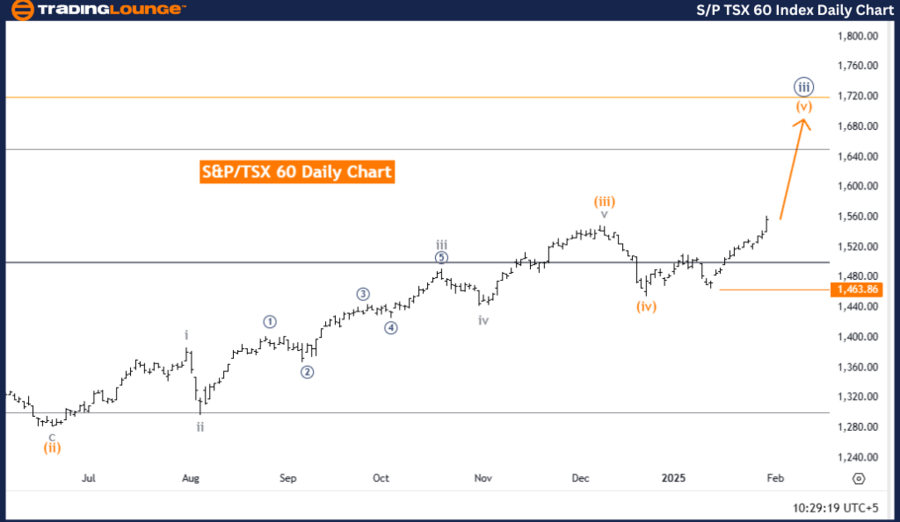
S&P/TSX 60 Index Daily Chart Analysis

S&P/TSX 60 Elliott Wave Technical Analysis

S&P/TSX 60 Index Technical Overview

  • Function: Trend
  • Mode: Impulsive
  • Structure: Orange Wave 5
  • Position: Navy Blue Wave 3
  • Direction Next Lower Degrees: Navy Blue Wave 4

Details:

  • Orange Wave 4 has likely completed.
  • Orange Wave 5 is currently forming.
  • Wave cancellation invalid level: 1,463.86

S&P/TSX 60 Elliott Wave Analysis Overview

The S&P/TSX 60 Elliott Wave Analysis on the daily chart provides a structured technical outlook on the index’s price trend and wave pattern, offering insights for traders.

Market Trend & Structure

  • The market is in an impulsive phase, indicating a strong, directional movement.

  • The current wave structure is labeled Orange Wave 5, a sub-wave within Navy Blue Wave 3, part of a larger Elliott Wave sequence.

Key Observations

Orange Wave 4 has concluded, leading to the development of Orange Wave 5, signaling continued bullish momentum.
Next expected move: Navy Blue Wave 4, typically a corrective phase after an impulsive wave.
Traders should closely watch Orange Wave 5, as its completion could mark the beginning of Navy Blue Wave 4.
Wave cancellation invalidation level: 1,463.86 – If the price drops below this point, the current wave count becomes invalid, requiring a new analysis.

Conclusion

The S&P/TSX 60 remains in an impulsive trend, with Orange Wave 5 progressing within Navy Blue Wave 3. The completion of Orange Wave 4 has set the market up for continued bullish movement.

Traders should monitor wave progression closely and pay attention to the invalidation level of 1,463.86 to confirm the integrity of the current Elliott Wave structure. This analysis offers a systematic framework to assess the market’s trend direction and potential price movements.

SP-TSX-60-Index-Dail...


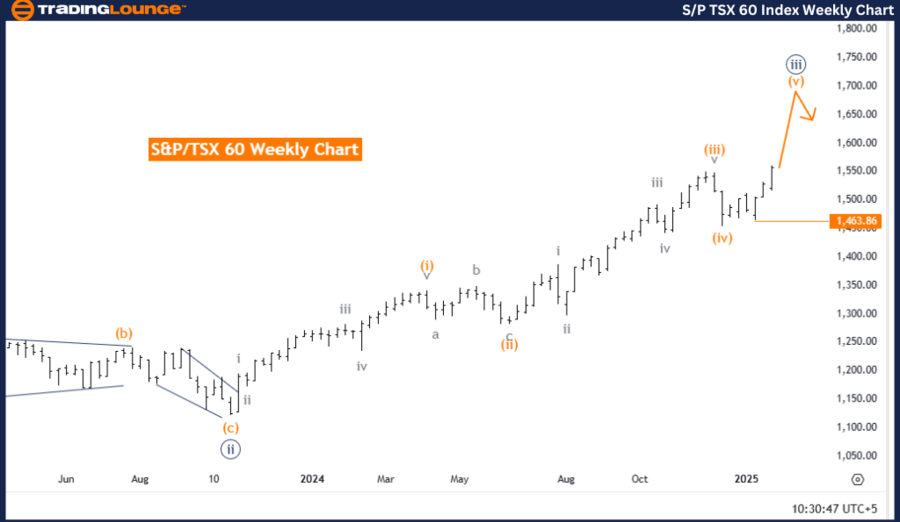
S&P/TSX 60 Elliott Wave Analysis – TradingLounge Weekly Chart

S&P/TSX 60 Elliott Wave Technical Analysis

S&P/TSX 60 Technical Overview

  • Function: Trend
  • Mode: Impulsive
  • Structure: Orange Wave 5
  • Position: Navy Blue Wave 3
  • Direction Next Lower Degrees: Navy Blue Wave 4

Details:

  • Orange Wave 4 appears completed.
  • Orange Wave 5 is currently forming.
  • Wave cancellation invalid level: 1,463.86

S&P/TSX 60 Elliott Wave Analysis Overview

The S&P/TSX 60 Elliott Wave Analysis on the weekly chart provides a broader technical outlook on the current trend direction and wave positioning.

Market Trend & Structure

  • The market is impulsive, indicating a sustained directional trend.

  • The current wave formation is labeled Orange Wave 5, a sub-wave of Navy Blue Wave 3, part of a larger Elliott Wave cycle.

Key Observations

Orange Wave 4 has concluded, and Orange Wave 5 is advancing, suggesting continued upward movement.
✔ The next expected move at a lower degree is Navy Blue Wave 4, a corrective phase that typically follows an impulsive wave.
Traders should monitor Orange Wave 5’s progress, as its completion could signal the beginning of Navy Blue Wave 4.
Wave invalidation level: 1,463.86 – If the price moves below this level, the wave count must be reassessed.

Conclusion

The S&P/TSX 60 remains in a strong impulsive phase, with Orange Wave 5 progressing inside Navy Blue Wave 3. The completion of Orange Wave 4 has set the stage for further upside.

Traders should keep a close watch on wave progression and validate the structure by ensuring the price remains above the invalidation level of 1,463.86. This analysis offers a structured market approach, enabling traders to anticipate future movements and potential trend reversals.

Technical Analyst: Malik Awais

Source: visit Tradinglounge.com and learn From the Experts Join TradingLounge Here 

Previous: Euro Stoxx 50 Elliott Wave Technical Analysis

VALUE Offer - Buy 1 Month & Get 3 Months!Click here

Access 7 Analysts Over 200 Markets Covered. Chat Room With Support

SP-TSX-60-Index-Week...

Related

DOW JONES (DJI) Elliott Wave Analysis: Stock Market Trends, Corrective Phase Insights & Trading Strategy for Investors

DOW JONES (DJI) Elliott Wave Analysis: Stock Market Trends, Corrective Phase Insights & Trading Strategy for Investors

Elliott Wave analysis of the Dow Jones Industrial Average (DJI) provides insights into the current c...

Read More >
NIFTY 50 Elliott Wave Analysis – Market Trend Forecast, Impulse & Corrective Waves, Trading Signals, and Stock Market Predictions

NIFTY 50 Elliott Wave Analysis – Market Trend Forecast, Impulse & Corrective Waves, Trading Signals, and Stock Market Predictions

NIFTY 50 Elliott Wave analysis, highlighting market trends, impulse waves, and corrective structures...

Read More >
UNIUSD Crypto Price and Elliott Wave Technical Analysis Uniswap's Focusing on Wave Structure and Bullish Momentum

UNIUSD Crypto Price and Elliott Wave Technical Analysis Uniswap's Focusing on Wave Structure and Bullish Momentum

This article provides an in-depth Elliott Wave analysis of Uniswap (UNIUSD), covering price movement...

Read More >
Australian Dollar/Japanese Yen(AUDJPY) Elliott Wave Technical Analysis 31 January 24

Australian Dollar/Japanese Yen(AUDJPY) Elliott Wave Technical Analysis 31 January 24

Trading Lounge Day and 4-hour Chart AUDJPY Elliott Wave Analysis dated 31 January 24, provides a det...

Read More >
Asian Paints Stock Forecast Using Elliott Wave: Impulsive Rally Nearing Completion, Expect Reversal and Trading Opportunities Soon

Asian Paints Stock Forecast Using Elliott Wave: Impulsive Rally Nearing Completion, Expect Reversal and Trading Opportunities Soon

Asian Paints is advancing in an impulsive Elliott Wave structure, nearing the final leg of a counter...

Read More >
Current Bearish Trend Unfolding in the U.S. Dollar / Japanese Yen Forex Market: USDJPY Elliott Wave Technical Analysis

Current Bearish Trend Unfolding in the U.S. Dollar / Japanese Yen Forex Market: USDJPY Elliott Wave Technical Analysis

In this USDJPY Elliott Wave analysis, we explore the current bearish trend unfolding in the forex ma...

Read More >

Buy 1 Month

Get 3 Months!

Special Offer:

Trade Recommendations

Unleash the power of deversified trading with our comprehensive portfolio, covering:

  • Stock Trades
  • Crypto Trades
  • Forex Trades
  • Commodity Trades
Elliott Wave Analysis

Gain a competive edge with expert insights in to:

  • Global Indices
  • US Stocks & ASX Stocks
  • Forex & Crypto
  • Commodities
Top-Notch Trading Tools

Equip yourself with the tools of success:

  • Social Chat
  • Elliott Wave Algorithm
  • Screener
  • TradingLevels
  • Trading Game
7 Elliott Wave Analysts

Stay ahead of the market with daily charts and insightful videos
-Your secret to strategic trading!

JOIN HERE


Welcome to TradingLounge (ASIC A.R.No. 321187), specialists in trades, trading education and technical analysis, covering stocks, indices, commodities, forex and cryptocurrencies.

When you join TradingLounge you have access to everything we offer, including trade tools, educational content and a social platform to chat with like-minded investors.

Read more

@Copyright 2024 by tradinglounge.com

Contact Us

Australian no: 02 4787 6020

International no: +61 (2) 47876020

Pay with:

Find us on