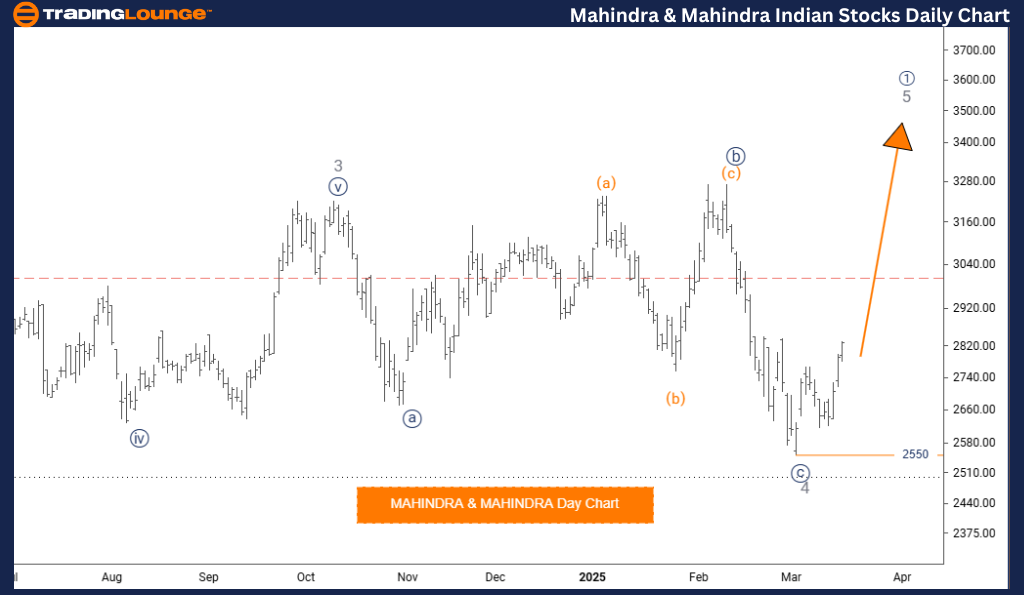
Mahindra & Mahindra Elliott Wave Analysis – Trading Lounge Day Chart
Mahindra & Mahindra Elliott Wave Technical Analysis
Function: Bullish Trend
Mode: Impulsive
Structure: Navy Blue Wave 1
Position: Gray Wave 5
Direction Next Lower Degree: Navy Blue Wave 2
Wave Cancel Invalidation Level: 2550
Analysis Overview
The Mahindra & Mahindra Elliott Wave Analysis on the daily chart provides a detailed outlook on the stock's price trend and potential future movements.
- The stock is in a bullish trend, characterized by impulsive rather than corrective price action.
- The primary wave under observation is Navy Blue Wave 1, forming part of a larger wave within Gray Wave 5.
- It is likely that Gray Wave 4 has concluded, and the market is transitioning into Navy Blue Wave 1 of 5.
- This wave is anticipated to be strong and directional, leading the market higher before the next significant correction.
- The next critical phase to monitor is Navy Blue Wave 2, expected to develop once Navy Blue Wave 1 completes.
Key Levels & Trading Considerations
If the stock price falls below this level, the current Elliott Wave count would be invalid, indicating a potential shift in trend.
Monitor Navy Blue Wave 1 as it progresses.
Be prepared for the potential start of Navy Blue Wave 2 once the current wave structure completes.
Trading Insights
This daily chart analysis offers a short-term perspective on Mahindra & Mahindra stock price action, helping traders make well-informed decisions.
- Recognizing wave formations and key price levels is essential for effective trading strategies.
- Identifying wave completions and new trend formations enables traders to anticipate market movements with better accuracy.
- A structured approach to market trends allows traders to align their strategies with short-term price fluctuations.
Conclusion
This Elliott Wave Analysis of Mahindra & Mahindra provides a comprehensive framework for traders seeking to interpret price action in a bullish market. By focusing on wave structures, trend transitions, and key price levels, traders can navigate market conditions with more confidence.
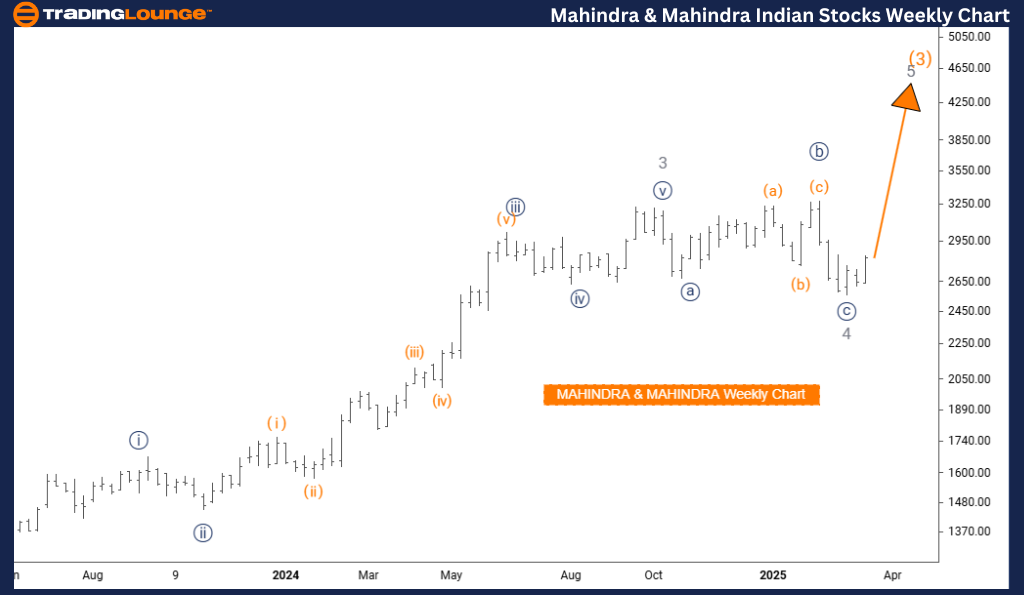
Mahindra & Mahindra Elliott Wave Analysis – Trading Lounge Weekly Chart
Mahindra & Mahindra Elliott Wave Technical Analysis
Function: Bullish Trend
Mode: Impulsive
Structure: Gray Wave 5
Position: Orange Wave 3
Direction Next Lower Degree: Gray Wave 5 (Started)
Analysis Overview
The Mahindra & Mahindra Elliott Wave Analysis for the weekly chart provides a long-term perspective on stock price movements and potential future trends.
- The market remains in a bullish phase, dominated by impulsive price movements instead of corrective actions.
- The primary wave in focus is Gray Wave 5, part of a larger wave structure within Orange Wave 3.
- Gray Wave 4 appears to have completed, with the market transitioning into Gray Wave 5.
- Gray Wave 5 is expected to continue its impulsive upward movement, possibly leading to new highs before a major trend shift.
- The next lower-degree wave to watch is Gray Wave 5, which has already commenced and is expected to extend higher.
Key Trading Considerations
- Monitor Gray Wave 5 as it progresses, as it will dictate the stock's long-term trend continuation.
- Prepare for further bullish momentum, ensuring alignment with the ongoing uptrend.
- Traders should focus on Elliott Wave structure analysis to make informed trading decisions.
Trading Insights
This weekly chart analysis offers traders a macro-level perspective on Mahindra & Mahindra stock movements.
- Understanding wave structures and trend formations is crucial for strategic decision-making.
- Recognizing wave completions and emerging trend shifts allows traders to anticipate market movements effectively.
- A long-term perspective helps traders align their investment strategies with broader market cycles.
Conclusion
This Elliott Wave Analysis of Mahindra & Mahindra presents a structured methodology for interpreting market trends and price movements. By leveraging wave structures, key price levels, and trend shifts, traders can make data-driven trading decisions with greater confidence.
Technical Analyst: Malik Awais
Source: visit Tradinglounge.com and learn From the Experts Join TradingLounge Here
Previous:HCL TECHNOLOGY Elliott Wave Technical Analysis
VALUE Offer - Buy 1 Month & Get 3 Months!Click here
Access 7 Analysts Over 200 Markets Covered. Chat Room With Support