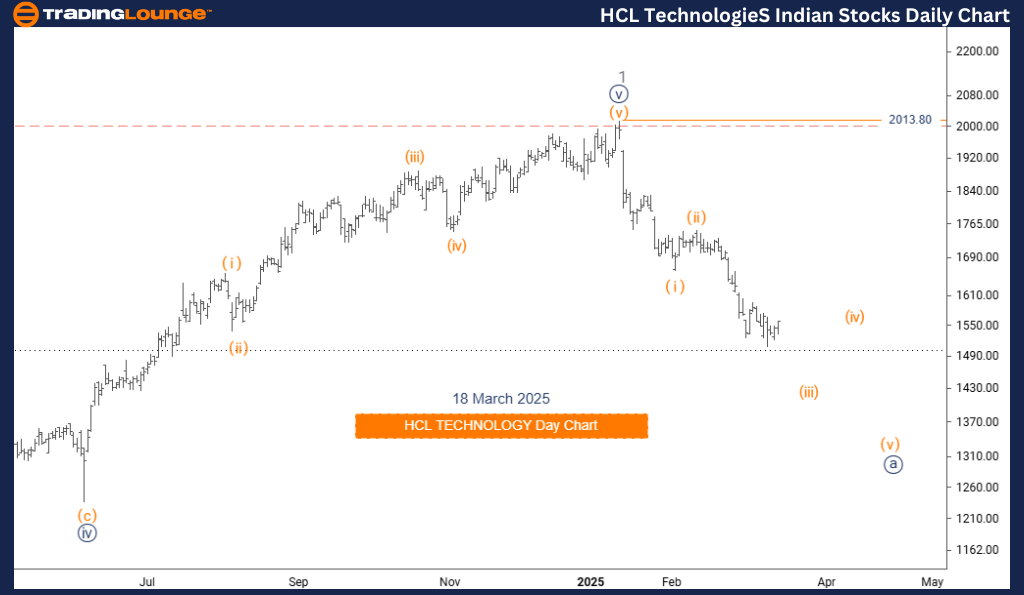
HCL TECHNOLOGY Elliott Wave Analysis – Trading Lounge Daily Chart
HCL TECHNOLOGY Elliott Wave Technical Analysis
Function: Counter-Trend
Mode: Impulsive
Structure: Navy Blue Wave A
Position: Gray Wave 2
Next Higher Degree Direction: Navy Blue Wave B
Wave Cancel Invalidation Level: 2013.80
Analysis Overview
The HCL TECHNOLOGY Elliott Wave Analysis for the daily chart provides an in-depth market review, focusing on current price action and potential trend developments.
The market remains in a counter-trend phase, displaying impulsive movement instead of corrective price action. The primary wave structure, Navy Blue Wave A, is currently developing within Gray Wave 2, highlighting its placement in the broader Elliott Wave pattern.
Key Insights
- Gray Wave 1 has likely completed, signaling the market's transition into Navy Blue Wave A.
- This impulsive wave structure suggests heightened market volatility, leading to potential price swings before the next wave emerges.
- Navy Blue Wave B is the next wave to monitor, anticipated to form once Navy Blue Wave A concludes.
- The invalidation level at 2013.80 is crucial. A price break below this level invalidates the current wave count, indicating a possible trend reversal.
Trading Implications & Market Outlook
Traders should closely watch the completion of Navy Blue Wave A, as its conclusion could mark the beginning of Navy Blue Wave B, presenting new trading opportunities.
By analyzing the daily chart, traders can align their strategies with short-term market trends and key price levels. Understanding Elliott Wave structures enhances entry and exit precision, improving decision-making for active traders.
A structured approach to wave analysis helps traders stay ahead of market movements, allowing them to adapt their strategies effectively and maximize trading opportunities.
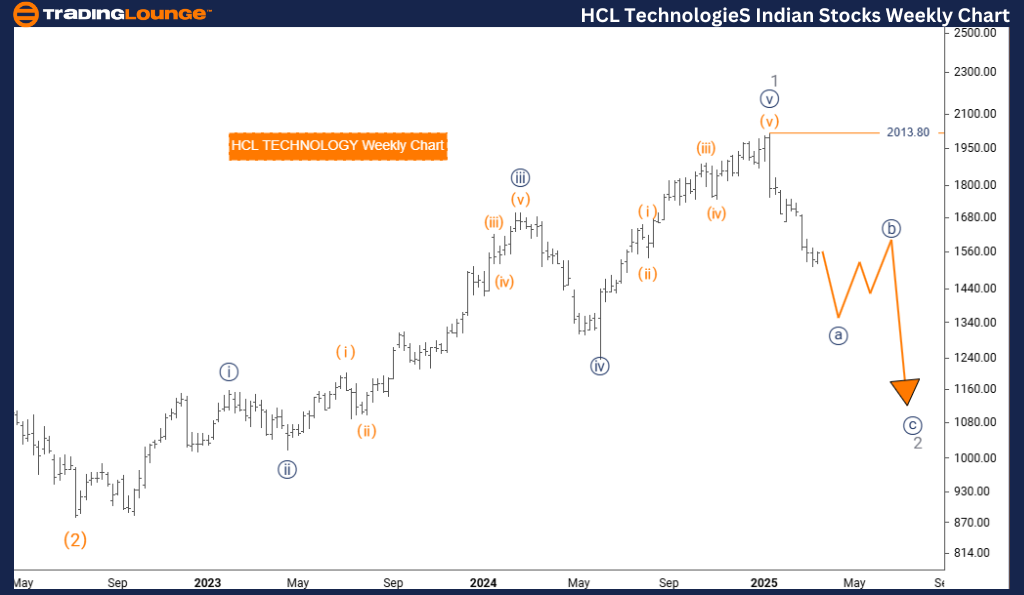
HCL TECHNOLOGY Elliott Wave Analysis – Trading Lounge Weekly Chart
HCL TECHNOLOGY Elliott Wave Technical Analysis
Function: Counter-Trend
Mode: Impulsive
Structure: Navy Blue Wave A
Position: Gray Wave 2
Next Higher Degree Direction: Navy Blue Wave B
Wave Cancel Invalidation Level: 2013.80
Analysis Overview
The HCL TECHNOLOGY Elliott Wave Analysis for the weekly chart delivers a comprehensive market perspective, evaluating major price trends and potential future movements.
The market is currently in a counter-trend phase, characterized by impulsive movement rather than corrective action. Navy Blue Wave A remains the dominant wave, unfolding within Gray Wave 2, positioning itself in the broader Elliott Wave structure.
Key Insights
- Gray Wave 1 has likely concluded, with the market now shifting into Navy Blue Wave A.
- This impulsive price movement suggests continued market volatility before the emergence of the next trend.
- Navy Blue Wave B is the next wave to monitor, projected to take shape following Navy Blue Wave A.
- The critical invalidation level at 2013.80 serves as a key reference point—if the price falls below this level, the current wave structure becomes invalid, indicating a potential trend reversal.
Trading Implications & Market Outlook
Traders should pay close attention to the completion of Navy Blue Wave A, as this may signal the beginning of Navy Blue Wave B, introducing new trading setups.
By analyzing the weekly chart, traders can gain a long-term perspective on market trends, aligning their strategies with major price shifts. Focusing on wave structures and key price levels enhances trading precision and helps identify profitable opportunities.
A structured wave analysis approach allows traders to remain prepared for evolving market dynamics, ensuring they can adjust their strategies effectively to capitalize on price movements.
Technical Analyst: Malik Awais
Source: visit Tradinglounge.com and learn From the Experts Join TradingLounge Here
Previous:ADANI ENTERPRISES Elliott Wave Technical Analysis
VALUE Offer - Buy 1 Month & Get 3 Months!Click here
Access 7 Analysts Over 200 Markets Covered. Chat Room With Support