TradingLounge THETAUSD Elliott Wave Analysis Daily Chart Overview
At its core, Elliott Wave Analysis interprets market movements as a series of five waves in the direction of the prevailing trend (impulse waves) and three waves against it (corrective waves). This framework is applied to the Theta Token (THETA/USD) daily and 4-hour charts, revealing intriguing patterns and predictions for future price movements.
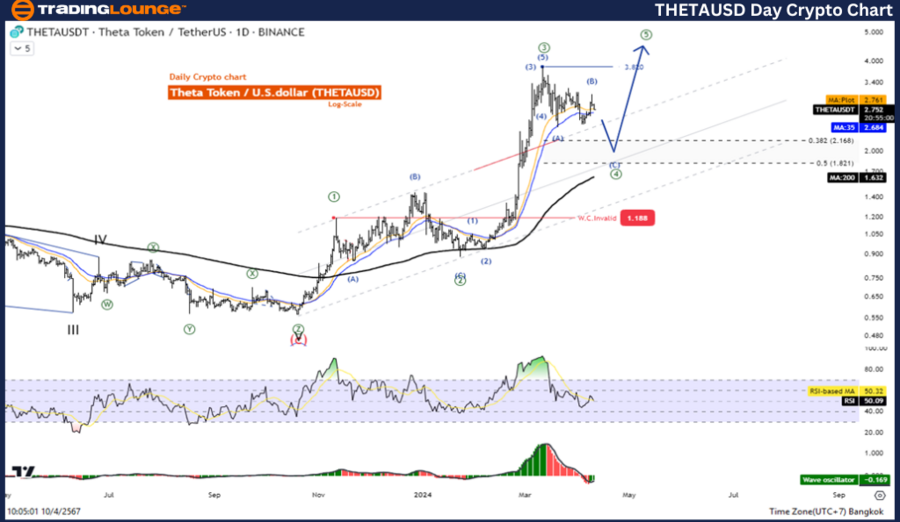
Theta Token/ U.S. dollar(THETAUSD) Day Chart Analysis
THETAUSD Elliott Wave Technical Analysis
Function: Counter trend
Mode: Corrective
Structure: Zigzag
Position: Wave ((B))
Direction Next higher Degrees: wave I of Impulse
Wave Cancel invalid Level:
Details: the corrective of Wave 4 has a trend to 38.2% of Wave 3
Theta Token/ U.S. dollar(THETAUSD)Trading Strategy:
Theta Token is still in an uptrend. With the Impulse style movement, we are still missing two more moves to complete the style. in the fourth wave decline and increase again in the fifth wave. Currently, prices are corrected in the fourth wave. It is likely to go down to test 2.168, waiting for the correction to complete to join the trend again.
Theta Token/ U.S. dollar(THETAUSD)Technical Indicators: The price is above the MA200 indicating an Uptrend, The Wave Oscillator is a bearish Momentum.

Elliott Wave Analysis of THETAUSD TradingLounge 4Hr Chart
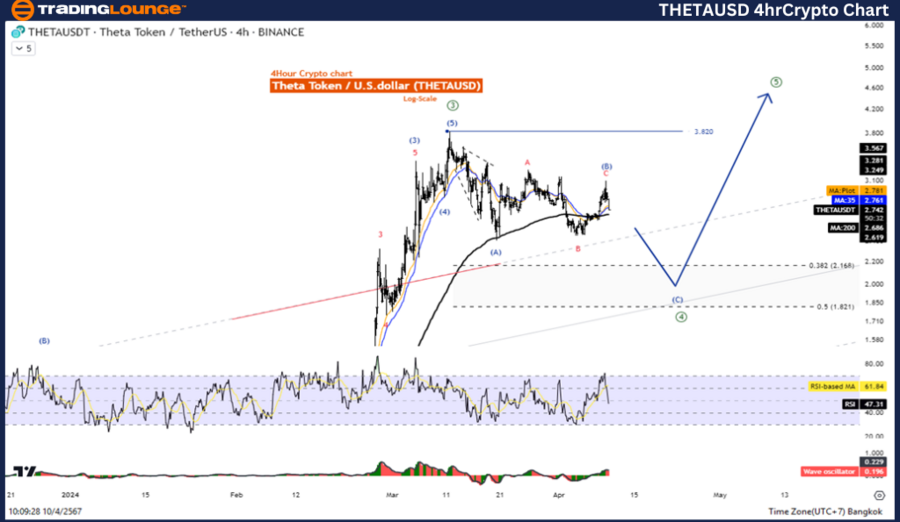
Theta Token/ U.S. dollar(THETAUSD) 4Hr Chart Analysis
THETAUSD Elliott Wave Technical Insight
Function: Counter trend
Mode: 00
Structure: Flat
Position: Wave ((B))
Direction Next higher Degrees: wave I of Impulse
Wave Cancel invalid Level:
Details: the corrective of Wave 4 has a trend to 38.2% of Wave 3
Theta Token/ U.S. dollar(THETAUSD)Trading Strategy:
Theta Token is still in an uptrend. With the Impulse style movement, we are still missing two more moves to complete the style. in the fourth wave decline and increase again in the fifth wave. Currently, prices are corrected in the fourth wave. It is likely to go down to test 2.168, waiting for the correction to complete to join the trend again.
Theta Token/ U.S. dollar(THETAUSD)Technical Indicators: The price is above the MA200 indicating an Uptrend, The Wave Oscillator is a bearish Momentum.
Conclusion
Elliott Wave Analysis presents a nuanced perspective on the THETA/USD trading pair, blending technical indicators with wave patterns to forecast market movements. For traders equipped with this analysis, the current phase offers a strategic opportunity to anticipate the next wave in the Theta Token's price trajectory. By aligning trading strategies with the insights gleaned from both daily and 4-hour charts, traders can navigate the THETA/USD market with increased confidence and precision.
Technical Analyst: Kittiampon Somboonsod
Source: visit Tradinglounge.com and learn From the Experts Join TradingLounge Here
See Previous: Ethereum/ U.S. dollar(ETHUSD)
TradingLounge Once Off SPECIAL DEAL: Here > 1 month Get 3 months.
TradingLounge's Free Week Extravaganza!
April 14 – 21: Unlock the Doors to Trading Excellence — Absolutely FREE
