In this technical analysis of Theta Token against the U.S. dollar (THETAUSD), we employ Elliott Wave Theory to decipher potential price movements. By scrutinizing the market structure, wave patterns, and key indicators, we aim to provide insights into the probable direction of THETAUSD.
Elliott Wave Analysis TradingLounge Daily Chart, 20 February 24,
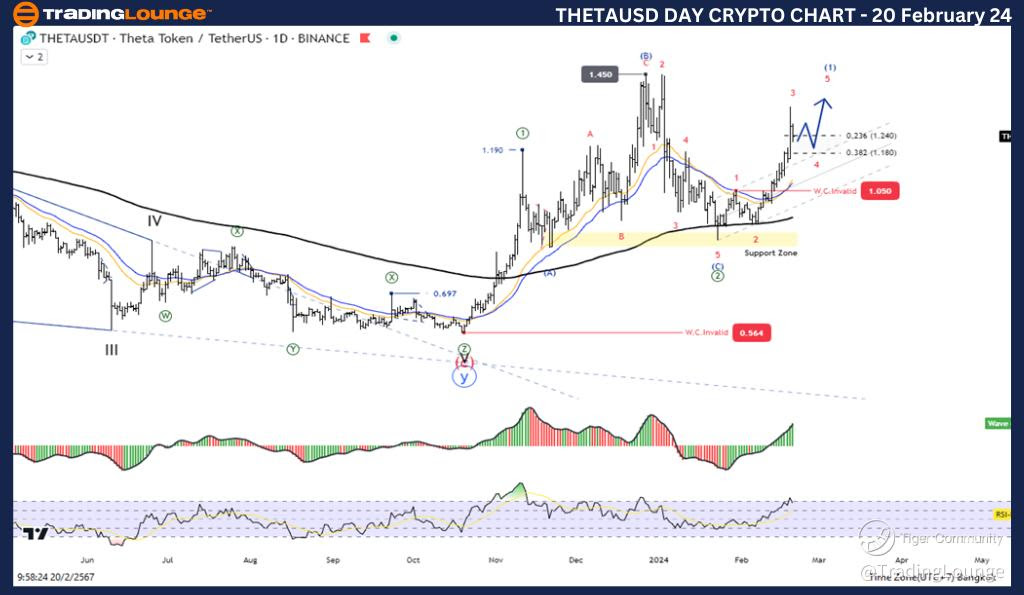
THETAUSD Elliott Wave Technical Analysis
Function: Following the Trend
Mode: Motive
Structure: Impulse
Current Position: Wave (1) Next Higher Degree
Direction: Wave ((3)) of Impulse Invalidation
Level: Wave Cancel
Technical Interpretation: Examining the current wave structure on the daily chart reveals a five-wave increase in Wave (1). This bullish impulse suggests a prevailing uptrend, with the price potentially poised for further gains.
Theta Token/ U.S. dollar Trading Strategy: Given the completion of the five-wave increase within the current impulse, with three upward moves already executed and two decline moves pending, the overall outlook favors an uptrend continuation. Traders may consider opportunities for long positions as the price retains the potential for upward momentum.
THETAUSD Technical Indicators: Notably, the price remains above the MA200, signaling an ongoing uptrend. Additionally, Wave Oscillators indicate bullish momentum, further supporting the case for a bullish bias in THETAUSD.
Elliott Wave Analysis TradingLounge 4Hr Chart, 20 February 24,
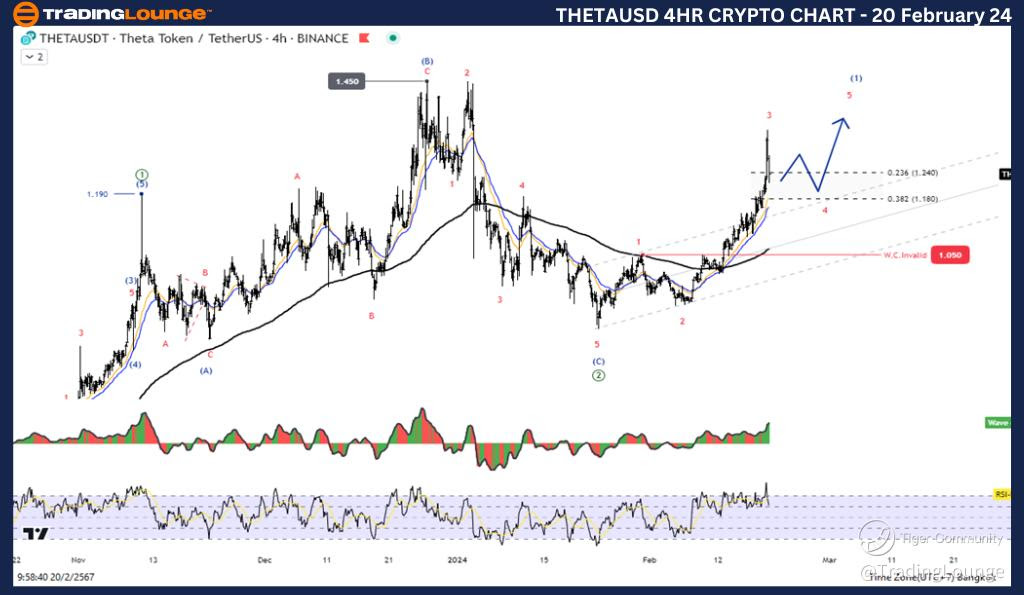
Theta Token/ U.S. dollar Elliott Wave Analysis
Function: Following the Trend
Mode: Motive
Structure: Impulse
Current Position: Wave (1) Next Higher Degree
Direction: Wave ((3)) of Impulse Invalidation
Level: Wave Cancel
THETAUSD Technical Interpretation: Similar to the daily chart analysis, the 4-hour chart reflects a five-wave increase within Wave (1). This reinforces the bullish sentiment, suggesting continued upward movement in THETAUSD.
THETAUSD Trading Strategy: With the ongoing impulse showcasing a three-wave advance and two corrective moves anticipated, the overall trend remains bullish. Traders may capitalize on potential buying opportunities, anticipating further upward price action.
Theta Token/ U.S. dollar Technical Indicators: Consistent with the daily chart analysis, technical indicators on the 4-hour timeframe also support the bullish outlook. The price remains above the MA200, indicating an uptrend, while Wave Oscillators exhibit bullish momentum, strengthening the bullish case for THETAUSD.
TradingLounge Analyst: Kittiampon Somboonsod, CEWA
Source: visit Tradinglounge.com and learn From the Experts Join TradingLounge Here
See Previous: Bitcoin/ U.S. dollar (BTCUSD)
Conclusion: In conclusion, the Elliott Wave analysis of THETAUSD suggests a favorable environment for bullish trading strategies. With both daily and 4-hour charts indicating a completed impulse wave and favorable technical indicators supporting upward momentum, traders may consider long positions in anticipation of further price appreciation. However, prudent risk management practices should always be adhered to when executing trades in volatile markets.