Explore the latest insights and technical analysis of Bitcoin/ U.S. dollar (BTCUSD) through the lens of Elliott Wave theory. Discover key trends, and potential trading opportunities, and gain valuable insights for your investment decisions.
Elliott Wave Analysis TradingLounge Daily Chart, 19 February 24,
BTCUSD Elliott Wave Technical Analysis:
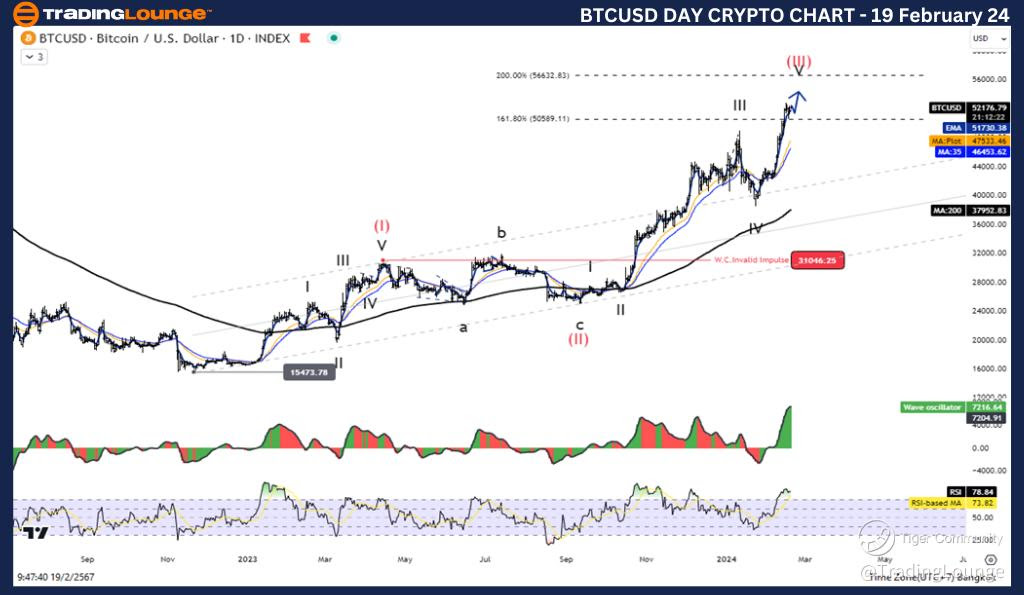
In this Elliott Wave analysis on the daily chart as of February 19, 24, BTCUSD demonstrates a compelling technical perspective. Operating in the Follow Trend function with a Motive mode and an Impulse structure, the current position indicates Wave V within the next higher degree, namely wave (III). The invalidation level is set at 31046.25, providing a critical reference point for wave cancelation.
Details of the analysis reveal a five-wave increase within wave (III), suggesting a bullish momentum. This technical scenario positions Bitcoin for potential upward movement, supported by the completion of a Wave II correction at the 81.485 level.
BTCUSD Trading Strategy:
Anticipating a resumption of bullish momentum, the trading strategy is aligned with the expectation of a five-wave increase. This analysis suggests a positive outlook for BTCUSD, with Wave II correction appearing to conclude at 81.485. Traders may find potential opportunities for long positions, leveraging the upward trend.
Bitcoin/ U.S. dollar Technical Indicators:
The technical indicators further support the bullish sentiment, with the price currently above the MA200, indicating a prevailing uptrend. Additionally, Wave Oscillators signal a bullish momentum, reinforcing the potential for an upward trajectory in BTCUSD.
TradingLounge Analyst: Kittiampon Somboonsod, CEWA
Elliott Wave Analysis TradingLounge 4-hour Chart, 19 February 24,
BTCUSD Elliott Wave Analysis
Delve into the 4-hour chart analysis of BTCUSD, revealing additional insights into the ongoing Elliott Wave dynamics as of February 19, 24.
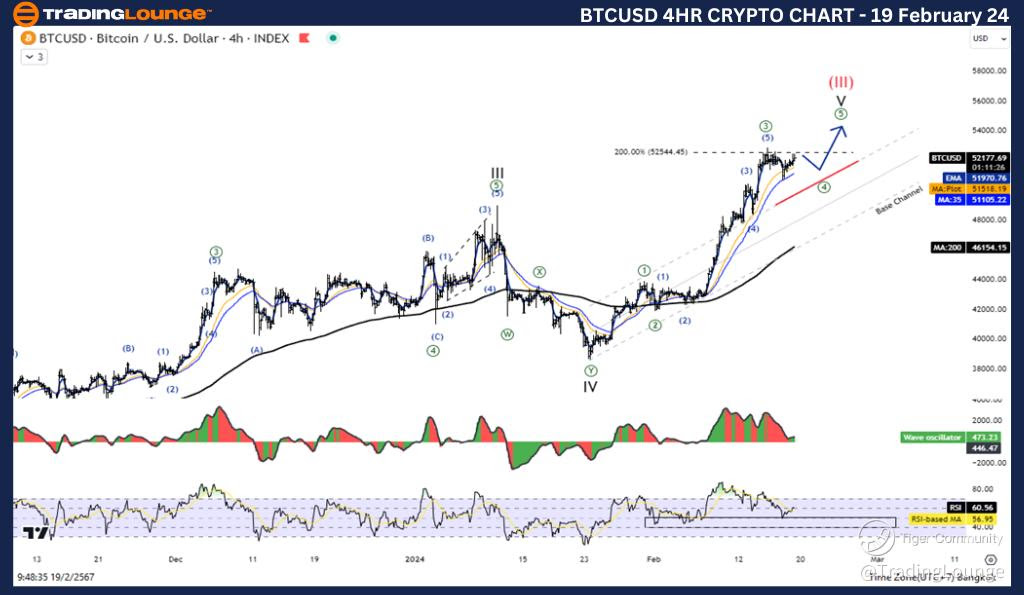
Functioning in the Follow Trend mode with an Impulse structure, the position reflects Wave V within the next higher degree, wave (III). The wave cancelation level remains at 31046.25, ensuring a clear reference point for invalidation.
Analysis details highlight the continuation of the unfinished rise of Wave (III) into Wave V, with a potential test of the 56632.83 level. This level corresponds to the 200% extension of Wave (I), providing a key target for the ongoing bullish momentum.
Bitcoin/ U.S. dollar Trading Strategy:
Building on the daily chart analysis, the 4-hour chart supports the expectation of a Wave V extension, presenting an opportunity to test the 56632.83 level. Traders can align their strategies with this anticipated upward movement, potentially capitalizing on the market dynamics.
BTCUSD Technical Indicators:
Consistency with the daily chart, and the technical indicators on the 4-hour chart underline the bullish sentiment. The price remains above the MA200, signifying an established uptrend, while Wave Oscillators exhibit a bullish momentum, reinforcing the positive outlook for BTCUSD.
TradingLounge Analyst: Kittiampon Somboonsod, CEWA
Source: visit Tradinglounge.com and learn From the Experts Join TradingLounge Here
See Previous: VeChain/USD
Conclusion:
In conclusion, the Elliott Wave analysis on both daily and 4-hour charts for BTCUSD indicates a favorable outlook for traders and investors. With the completion of Wave II correction and the potential extension of Wave V, market participants can leverage these insights to make informed decisions, aligning their strategies with the prevailing bullish momentum in the BTCUSD market. Stay tuned for further updates as the market evolves.