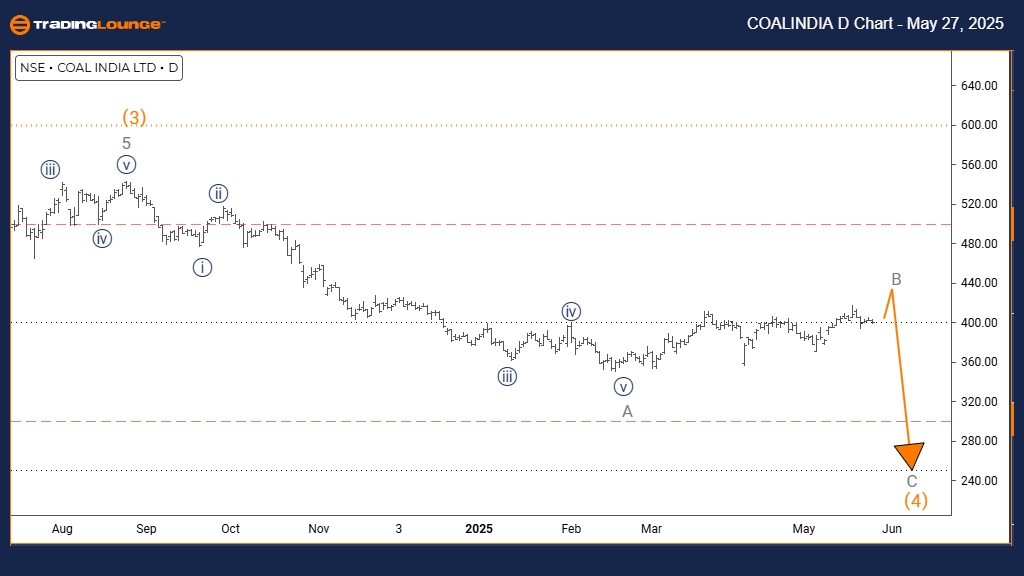
Coal India – Elliott Wave Analysis (Trading Lounge Day Chart)
Coal India Daily Technical Wave Forecast
FUNCTION: Counter-Trend
MODE: Corrective
STRUCTURE: Gray Wave B
POSITION: Orange Wave 4
DIRECTION NEXT LOWER DEGREES: Gray Wave C
DETAILS: Gray Wave A is likely complete, with Gray Wave B currently forming.
Market Overview
Coal India Ltd is undergoing a corrective Elliott Wave pattern. The daily chart reveals Gray Wave B progressing within Orange Wave 4, following the conclusion of the previous Gray Wave A decline. This positions the stock in a temporary recovery phase amid a prevailing bearish trend.
Wave Analysis Breakdown
The shift from Gray Wave A to B marks a corrective rally with restricted upward movement. Unless key resistance levels break, bearish momentum is expected to dominate. Upon Gray Wave B’s completion, Gray Wave C could potentially trigger the next leg down in the market.
Trading Environment
Traders should monitor Coal India for indications of Gray Wave B nearing completion. Signs such as a stall in price momentum or bearish reversal near resistance areas are critical. This phase remains corrective and not an indication of trend reversal, suggesting potential market volatility ahead.
Positioning Strategy
Adopt a cautious trading approach during this counter-trend phase. Wait for confirmation patterns before entering positions anticipating Wave C. The current wave structure hints at a temporary rally, with further declines probable once the corrective move concludes.
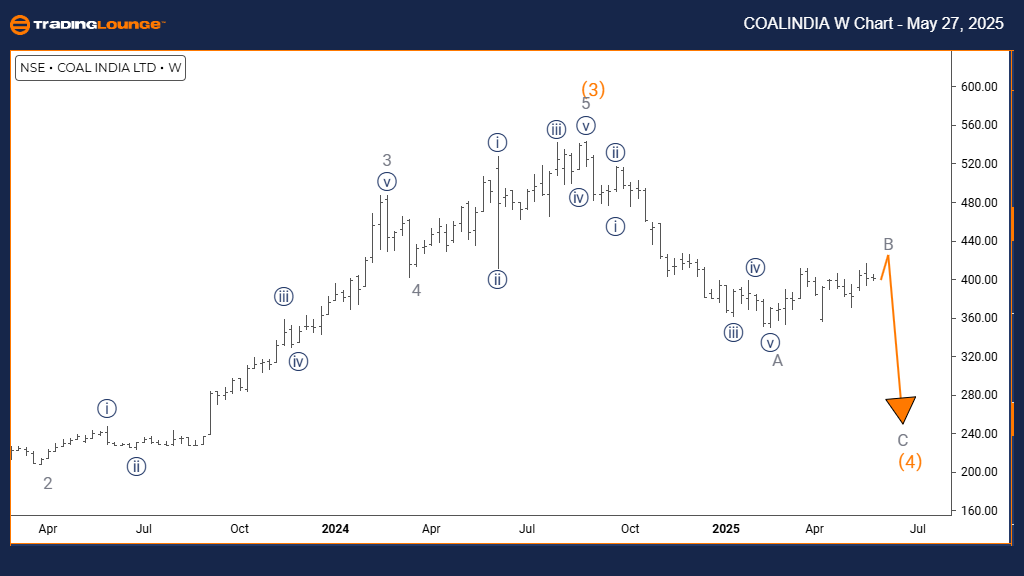
Coal India – Elliott Wave Analysis (Trading Lounge Weekly Chart)
Coal India Weekly Technical Forecast
FUNCTION: Counter-Trend
MODE: Corrective
STRUCTURE: Gray Wave B
POSITION: Orange Wave 4
DIRECTION NEXT LOWER DEGREES: Gray Wave C
DETAILS: Gray Wave A appears to have ended; Gray Wave B is in progress.
Weekly Market View
The weekly chart indicates Coal India remains in a corrective phase within a longer-term downtrend. Gray Wave B continues developing inside Orange Wave 4, following a prior bearish move by Gray Wave A. This configuration typically precedes a continuation of the prevailing trend.
Wave Progress Assessment
Gray Wave B could extend over a longer timeframe on the weekly chart. Despite short-term recovery, the price is likely to remain within standard Fibonacci retracement levels. This does not signal a trend reversal but suggests a pause in bearish movement.
Investment Outlook
Traders should track resistance levels and momentum indicators closely. A loss of upward strength can mark the end of Wave B. While there may be short-term gains, the broader trend points downward, with Gray Wave C projected to continue the bearish sequence.
Strategic Note
Be alert for technical signs such as bearish divergence or reversal patterns that indicate the end of Wave B. These patterns provide vital clues for the resumption of bearish momentum. This corrective structure is temporary and likely not the conclusion of the larger downtrend.
Technical Analyst: Malik Awais
Source: Visit Tradinglounge.com and learn from the Experts. Join TradingLounge Here
Previous: ADANI PORTS & SEZ Elliott Wave Technical Analysis
VALUE Offer - Buy 1 Month & Get 3 Months!Click here
Access 7 Analysts Over 200 Markets Covered. Chat Room With Support