26May

ADANI PORTS & SEZ - ADANIPORT Elliott Wave Forecast Shows Bullish Trend With Key 1040 Support

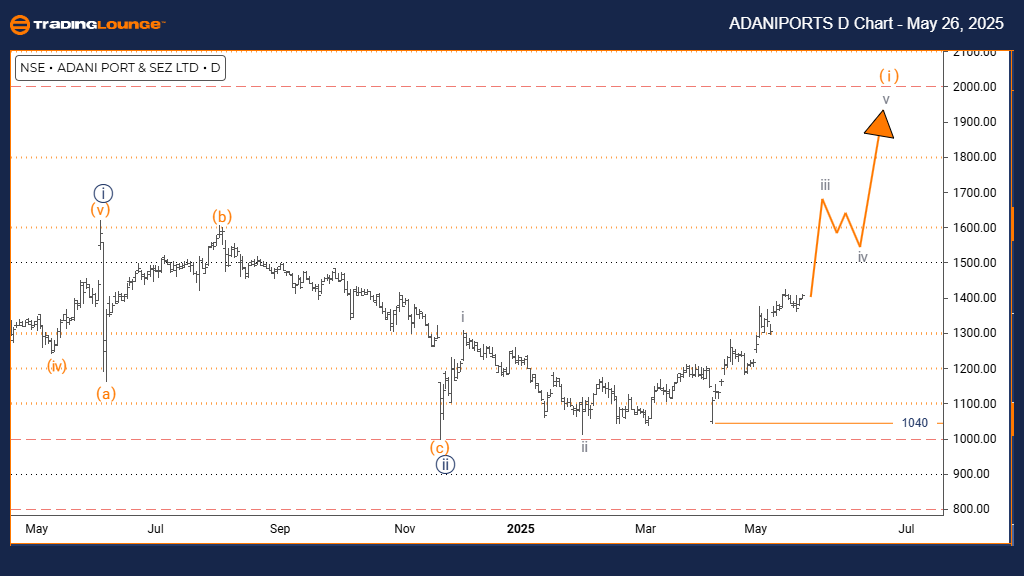
ADANI PORTS & SEZ – Elliott Wave Analysis | Trading Lounge Day Chart

ADANIPORT Elliott Wave Technical Analysis

FUNCTION: Bullish Trend

MODE: Impulsive

STRUCTURE: Gray Wave 3

POSITION: Orange Wave 1

DIRECTION NEXT LOWER DEGREES: Gray Wave 4

DETAILS: Gray Wave 2 appears to have completed, and Gray Wave 3 of 1 is currently unfolding.

Invalidation Level: 1040

The daily Elliott Wave chart for Adani Ports & SEZ shows an active bullish trend supported by impulsive wave development. This analysis marks the initiation of Gray Wave 3 within Orange Wave 1, suggesting that the corrective stage of Gray Wave 2 has likely ended and the trend is gaining strength.

Gray Wave 3 usually introduces a strong upside move, supported by increased market participation. Being part of Orange Wave 1, this wave phase indicates extended upward potential. A break below 1040 would invalidate this wave count and could indicate a deeper correction or trend reassessment.

This technical structure provides traders with clear direction in the current market phase. A minor correction — Gray Wave 4 — is anticipated after the ongoing rally, so active monitoring of trend continuation signals is advised. Traders should adjust their risk strategy as this bullish phase evolves.

ADANIPORT-d-index-ch...


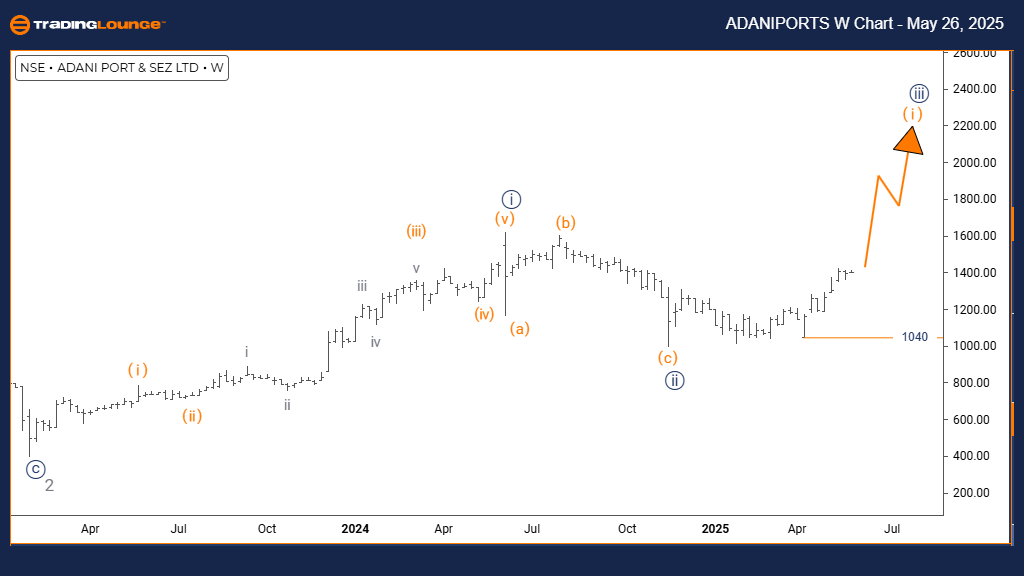
ADANI PORTS & SEZ – Elliott Wave Analysis | Trading Lounge Weekly Chart

ADANIPORT Elliott Wave Technical Analysis

FUNCTION: Bullish Trend

MODE: Impulsive

STRUCTURE: Orange Wave 1

POSITION: Navy Blue Wave 3

DIRECTION NEXT LOWER DEGREES: Orange Wave 2

DETAILS: Navy Blue Wave 2 appears complete, and Orange Wave 1 of 3 is unfolding.

Invalidation Level: 1040

The weekly chart for Adani Ports & SEZ supports a strong long-term bullish outlook. Current wave formation indicates Orange Wave 1 is progressing within the larger Navy Blue Wave 3, with Navy Blue Wave 2 likely completed.

Orange Wave 1 often reflects rising demand and early-stage price strength within an extended bullish trend. As part of Navy Blue Wave 3 — a commonly powerful move in the Elliott sequence — this wave structure hints at continued growth potential. A drop below 1040 would invalidate the present wave count and suggest a potential trend reevaluation.

This analysis positions Adani Ports & SEZ for a sustained uptrend, with Orange Wave 2 projected as the next corrective step. Investors focused on India’s infrastructure sector may find the current structure favorable for strategic entries or continuation setups.

Technical Analyst: Malik Awais

Source: Visit Tradinglounge.com and learn from the Experts. Join TradingLounge Here 

Previous: Bovespa Index Elliott Wave Technical Analysis

VALUE Offer - Buy 1 Month & Get 3 Months!Click here

Access 7 Analysts Over 200 Markets Covered. Chat Room With Support

ADANIPORT-w-index-ch...

Related

New Zealand Dollar/U.S.Dollar (NZDUSD) Elliott Wave Technical Analysis 12 January 24

New Zealand Dollar/U.S.Dollar (NZDUSD) Elliott Wave Technical Analysis 12 January 24

NZDUSD Elliott Wave Analysis for the daily chart on 12 January 24, suggests that the market is curre...

Read More >
Asian Paints Elliott Wave Technical Analysis: Share Price Forecast, Financial Overview, Earnings Reports & Market Trends

Asian Paints Elliott Wave Technical Analysis: Share Price Forecast, Financial Overview, Earnings Reports & Market Trends

Asian Paints share price movements, technical analysis, and future stock forecasts guides to cover f...

Read More >
New Zealand Dollar/U.S.Dollar(NZDUSD) Forex Elliott Wave Technical Analysis: Detailed forecast based on current wave patterns.

New Zealand Dollar/U.S.Dollar(NZDUSD) Forex Elliott Wave Technical Analysis: Detailed forecast based on current wave patterns.

This article provides an in-depth Elliott Wave analysis of the NZDUSD pair, offering a detailed fore...

Read More >
Dr Reddy's Laboratories: Comprehensive Elliott Wave Analysis Reveals Bullish Trends and Key Support Levels for Strategic Trading

Dr Reddy's Laboratories: Comprehensive Elliott Wave Analysis Reveals Bullish Trends and Key Support Levels for Strategic Trading

This article provides an in-depth Elliott Wave analysis of Dr Reddy's Laboratories, highlighting...

Read More >
Amazon Stock Elliott Wave Analysis: AMZN Forecast Shows Corrective Zigzag Pattern with $159 Price Target and Potential Reversal Ahead

Amazon Stock Elliott Wave Analysis: AMZN Forecast Shows Corrective Zigzag Pattern with $159 Price Target and Potential Reversal Ahead

Elliott Wave analysis of Amazon (AMZN) stock using daily and hourly charts. It identifies a correcti...

Read More >
Palo Alto Networks (PANW) Stock Forecast: Elliott Wave Signals Bullish Reversal With Price Targets & Key Support at $150

Palo Alto Networks (PANW) Stock Forecast: Elliott Wave Signals Bullish Reversal With Price Targets & Key Support at $150

PANW stock shows bullish momentum with Elliott Wave analysis indicating a completed correction and a...

Read More >

$1 for 2 Weeks

then $29 a month!

What a Special Offer!

Trade Recommendations

Unleash the power of deversified trading with our comprehensive portfolio, covering 250+ markets:

  • Stock Trades
  • Crypto Trades
  • Forex Trades
  • Commodity Trades
Elliott Wave Analysis

Gain a competitive edge with expert insights and AI-powered Elliott Wave charting into:

  • Global Indices
  • US Stocks & ASX Stocks
  • Forex & Crypto
  • Commodities
Top-Notch Trading Tools

Equip yourself with the tools of success:

  • Real-time Chat rooms
  • Elliott Wave Algorithm
  • Portfolio tools
  • TradingLevels
  • Screener
  • Trading Game
7 Elliott Wave Analysts

Stay ahead of the market with daily charts and insightful videos
Your secret to strategic trading!

JOIN HERE


Welcome to TradingLounge (ASIC A.R.No. 321187), specialists in trades, trading education and technical analysis, covering stocks, indices, commodities, forex and cryptocurrencies.

When you join TradingLounge you have access to everything we offer, including trade tools, educational content and a social platform to chat with like-minded investors.

Read more

@Copyright 2024 by tradinglounge.com

Contact Us

Australian no: 02 4787 6020

International no: +61 (2) 47876020

Pay with:

Find us on