16Jun

DOW JONES Elliott Wave Forecast Reveals Bullish Impulse Structure on DJI Daily and Weekly Charts With Key Price Support

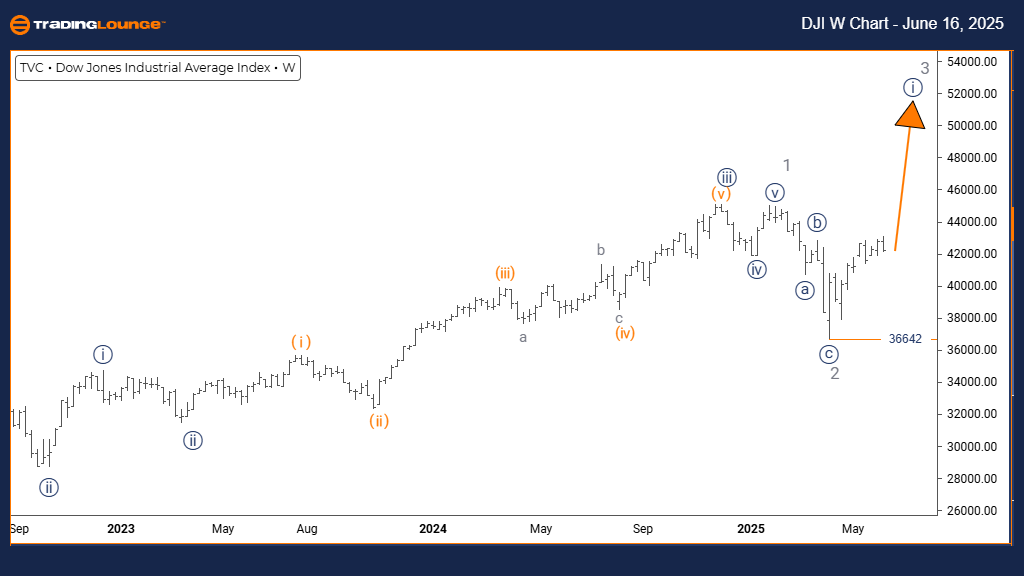
DOW JONES - DJI Elliott Wave Analysis | Trading Lounge Day Chart

DOW JONES - DJI Elliott Wave Technical Analysis

FUNCTION: Bullish Trend

MODE: Impulsive

STRUCTURE: Orange Wave 1

POSITION: Navy Blue Wave 1

DIRECTION NEXT LOWER DEGREES: Orange Wave 2

DETAILS: Gray Wave 2 is likely complete. Orange Wave 1 of Navy Blue Wave 1 is now unfolding.

Wave Cancel Invalidation Level: 36642

The DOW JONES Industrial Average (DJI) shows a bullish Elliott Wave structure on the daily timeframe. The market behavior is impulsive, indicating strong upward pressure. The current configuration identifies Orange Wave 1, which is developing within the framework of Navy Blue Wave 1. This suggests the index has entered an early stage of a broader bullish cycle.

Recent price action confirms the end of Gray Wave 2, marking the initiation of Orange Wave 1. Traders should anticipate the next correction as Orange Wave 2, which will likely serve as a short-term retracement before the upward trend continues.

A critical technical level to watch is 36642. Falling below this wave invalidation point would invalidate the present Elliott Wave count and necessitate a reassessment of the bullish scenario. As long as the index stays above this support, the outlook favors continued gains.

The current wave pattern aligns with sustained upward momentum under Navy Blue Wave 1, supported by the impulsive move of Orange Wave 1. With Gray Wave 2 confirmed complete, this reinforces the expectation for further buying activity and higher index levels.

DJI-d-index-chart-16...


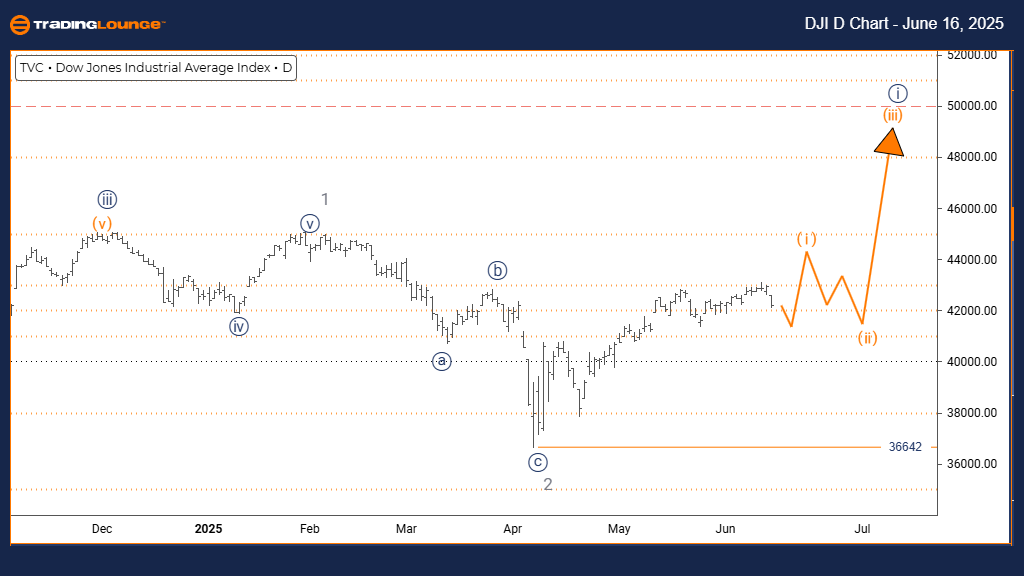
DOW JONES - DJI Elliott Wave Analysis | Trading Lounge Weekly Chart

DOW JONES - DJI Elliott Wave Technical Analysis

FUNCTION: Bullish Trend

MODE: Impulsive

STRUCTURE: Navy Blue Wave 1

POSITION: Gray Wave 3

DIRECTION NEXT LOWER DEGREES: Navy Blue Wave 2

DETAILS: Gray Wave 2 is complete. Navy Blue Wave 1 of Gray Wave 3 is in progress.

Wave Cancel Invalidation Level: 36642

The weekly Elliott Wave forecast for the DOW JONES (DJI) maintains a bullish trajectory, with an impulsive price structure. The wave label Navy Blue Wave 1 is part of a more extensive formation identified as Gray Wave 3, suggesting the index is initiating a significant uptrend.

Evidence shows the completion of Gray Wave 2, making way for Navy Blue Wave 1 within Gray Wave 3. The next logical step is Navy Blue Wave 2, expected to act as a moderate correction before bullish momentum resumes.

The wave invalidation level at 36642 serves as a critical benchmark. A move below this support would nullify the current wave setup. However, as long as the price remains above this line, the upward wave pattern stays intact.

The overall technical outlook indicates a strong potential for continued growth, with Navy Blue Wave 1 advancing under the influence of Gray Wave 3. The market's impulsive nature supports extended buying interest and rising prices in the coming sessions.

Technical Analyst: Malik Awais

Source: Visit Tradinglounge.com and learn from the Experts. Join TradingLounge Here

Previous: S&P/TSX 60 Elliott Wave Technical Analysis

VALUE Offer - $1 for 2 Weeks then $29 a month!Click here

Access 7 Analysts Over 200 Markets Covered. Chat Room With Support

DJI-w-index-chart-16...

Related

Adani Green Energy - ADANIGREEN Stock Forecast Using Elliott Wave Analysis on Daily and Weekly Charts

Adani Green Energy - ADANIGREEN Stock Forecast Using Elliott Wave Analysis on Daily and Weekly Charts

Elliott Wave analysis of Adani Green stock, highlighting trend direction, forecast patterns, and tra...

Read More >
"SP500 & NASDAQ Wave Insights: Stay Ahead of Key Market Shifts"

"SP500 & NASDAQ Wave Insights: Stay Ahead of Key Market Shifts"

The blog provides a comprehensive look at Elliott Wave trading strategies for major indices like SP5...

Read More >
Elliott Wave Technical  Analysis of Cardano (ADAUSD): Insights from Daily and H4 Technical Analysis

Elliott Wave Technical Analysis of Cardano (ADAUSD): Insights from Daily and H4 Technical Analysis

This article offers a comprehensive Elliott Wave analysis of Cardano (ADAUSD), providing key insight...

Read More >
Vanguard Australian Shares Index ETFA and V300AEQ ETF UNITS – VAS Stock Analysis & Elliott Wave Technical Forecast

Vanguard Australian Shares Index ETFA and V300AEQ ETF UNITS – VAS Stock Analysis & Elliott Wave Technical Forecast

This article provides an in-depth Elliott Wave analysis of the ASX: V300AEQ ETF – VAS, focusing on ...

Read More >
Elliott Wave Analysis of ASX: RMD ResMed Inc. Stock Performance, Financial Trends and Investment Opportunities

Elliott Wave Analysis of ASX: RMD ResMed Inc. Stock Performance, Financial Trends and Investment Opportunities

ResMed Inc. (ASX: RMD) stock performance, including price analysis, financials, dividend insights, a...

Read More >
Costco Wholesale Corp.(COST:NASDAQ) Elliott Wave Technical Analysis 19 October 23

Costco Wholesale Corp.(COST:NASDAQ) Elliott Wave Technical Analysis 19 October 23

Costco Wholesale Corp.(COST:NASDAQ) Elliott Wave Technical Analysis 19 October 23, We have been movi...

Read More >

$1 for 2 Weeks

then $29 a month!

What a Special Offer!

Trade Recommendations

Unleash the power of deversified trading with our comprehensive portfolio, covering 250+ markets:

  • Stock Trades
  • Crypto Trades
  • Forex Trades
  • Commodity Trades
Elliott Wave Analysis

Gain a competitive edge with expert insights and AI-powered Elliott Wave charting into:

  • Global Indices
  • US Stocks & ASX Stocks
  • Forex & Crypto
  • Commodities
Top-Notch Trading Tools

Equip yourself with the tools of success:

  • Real-time Chat rooms
  • Elliott Wave Algorithm
  • Portfolio tools
  • TradingLevels
  • Screener
  • Trading Game
7 Elliott Wave Analysts

Stay ahead of the market with daily charts and insightful videos
Your secret to strategic trading!

JOIN HERE


Welcome to TradingLounge (ASIC A.R.No. 321187), specialists in trades, trading education and technical analysis, covering stocks, indices, commodities, forex and cryptocurrencies.

When you join TradingLounge you have access to everything we offer, including trade tools, educational content and a social platform to chat with like-minded investors.

Read more

@Copyright 2024 by tradinglounge.com

Contact Us

Australian no: 02 4787 6020

International no: +61 (2) 47876020

Pay with:

Find us on