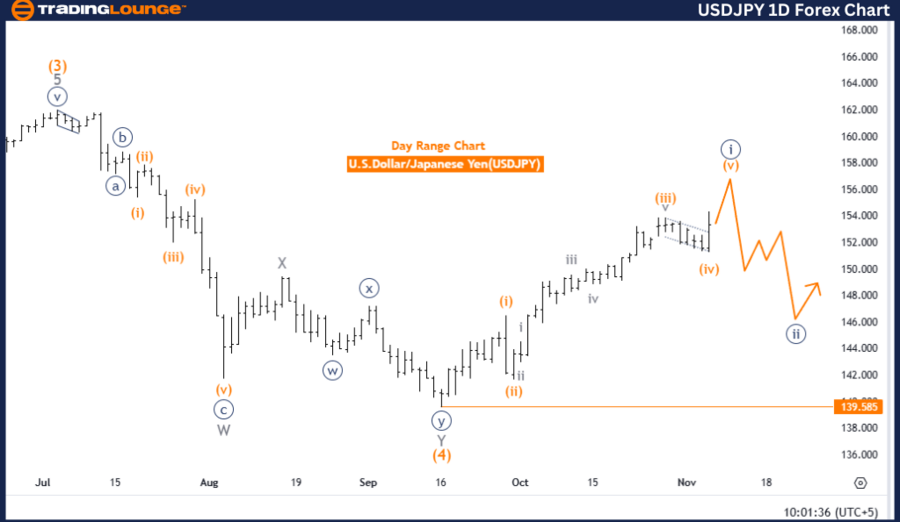
USDJPY (U.S. Dollar/Japanese Yen) TradingLounge Daily Chart
USDJPY Chart Focus: Elliott Wave Technical Analysis
Function: Trend
Mode: Impulsive
Wave Structure: Navy Blue Wave 1
Position: Within Gray Wave 1
Direction for Lower Degree: Transition to Navy Blue Wave 2
Details: The current structure of navy blue wave 1 within the larger gray wave 1 remains in development, with signs indicating it may soon complete.
Current USDJPY Elliott Wave Overview
The daily USDJPY chart reveals a solid upward trend, progressing in an impulsive mode through the development of navy blue wave 1 as part of the broader gray wave 1. Navy blue wave 1 is nearing its final stages, hinting at an impending transition to navy blue wave 2, which could introduce a corrective pullback phase.
This anticipated shift to navy blue wave 2 suggests that after the completion of navy blue wave 1, a retracement could unfold, serving as a correction within the overarching trend. A key invalidation level to watch is 139.585. A break below this level would negate the current wave structure and may alter the bullish outlook, signaling a potential momentum shift.
Short-Term Outlook and Key Levels
In the short term, USDJPY is likely to sustain its upward movement until navy blue wave 1 reaches completion. As this wave nears its conclusion, short-term gains are feasible, provided the price remains above the invalidation level. Focus remains on the nearing completion of navy blue wave 1 within gray wave 1, with traders watching closely for any signs indicating the start of a corrective navy blue wave 2.
Summary
USDJPY continues its upward trend, propelled by navy blue wave 1 within gray wave 1. The next critical phase involves monitoring for a possible transition into navy blue wave 2 as navy blue wave 1 approaches completion, with attention on the invalidation level at 139.585.
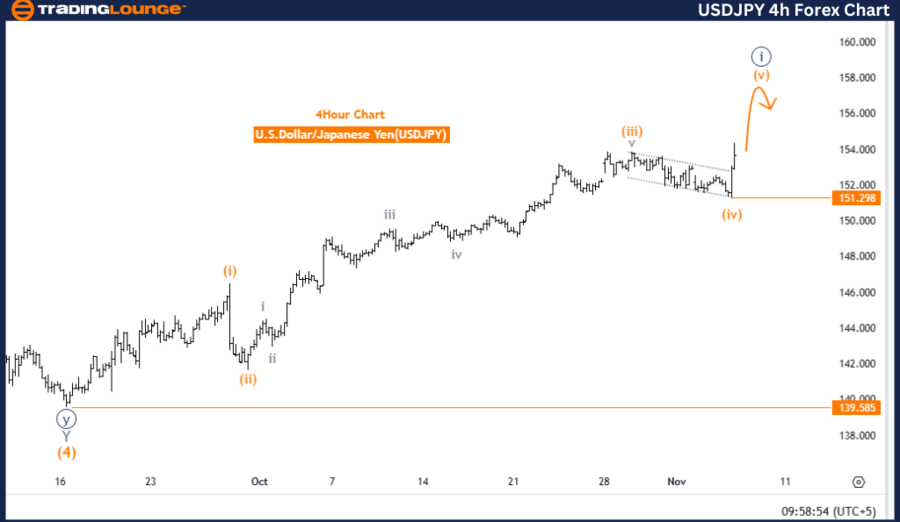
USDJPY (U.S. Dollar/Japanese Yen) 4-Hour Chart Analysis
Chart Focus: Elliott Wave Technical Analysis
Function: Trend
Mode: Impulsive
Wave Structure: Orange Wave 5
Position: Within Navy Blue Wave 1
Direction for Lower Degree: Transition to Navy Blue Wave 2
Details: After the completion of orange wave 4, orange wave 5 is now initiated within navy blue wave 1.
Current USDJPY Elliott Wave Overview
On the 4-hour chart, USDJPY continues its upward trajectory in impulsive mode, driven by orange wave 5 within the overarching navy blue wave 1. The recent completion of orange wave 4 signified the beginning of orange wave 5, pointing to further bullish momentum as this wave progresses.
Within the larger wave structure, navy blue wave 1 is progressing towards a likely shift to navy blue wave 2. This sequence suggests that, after the completion of orange wave 5, a corrective phase may emerge. Until navy blue wave 2 initiates, the trend remains upward, supported by the impulsive movement of orange wave 5.
Key Levels and Immediate Trend Focus
The critical level to observe is the wave invalidation threshold at 151.298. A break below this point would invalidate the current wave structure and indicate a shift away from the bullish trend. Provided the price stays above this level, the bullish outlook remains intact, with orange wave 5 anticipated to continue driving gains.
Summary
The 4-hour USDJPY chart maintains a bullish trend, with orange wave 5 sustaining momentum within navy blue wave 1. As long as the price holds above the invalidation level of 151.298, the upward movement is expected to persist in the short term. Attention remains on the completion of orange wave 5, which may then prompt a transition into the corrective phase of navy blue wave 2.
Technical Analyst: Malik Awais
Source: visit Tradinglounge.com and learn From the Experts Join TradingLounge Here
Previous: U.S. Dollar / Canadian Dollar (USDCAD) Elliott Wave Technical Analysis