05Mar

MACQUARIE GROUP LIMITED MQG Elliott Wave Analysis – Trading Strategy, and Technical Analysis for ASX Investors

ASX: Macquarie Group Limited (MQG) Elliott Wave Technical Analysis

Overview

Today's Elliott Wave analysis delivers an updated outlook on Macquarie Group Limited (ASX: MQG).

Our latest assessment suggests that MQG stock is nearing the final phase of Wave Four, unfolding as a flat pattern. This presents a potential bullish opportunity in Wave Five. Key price levels are highlighted to help traders assess trend validation or potential reversals.


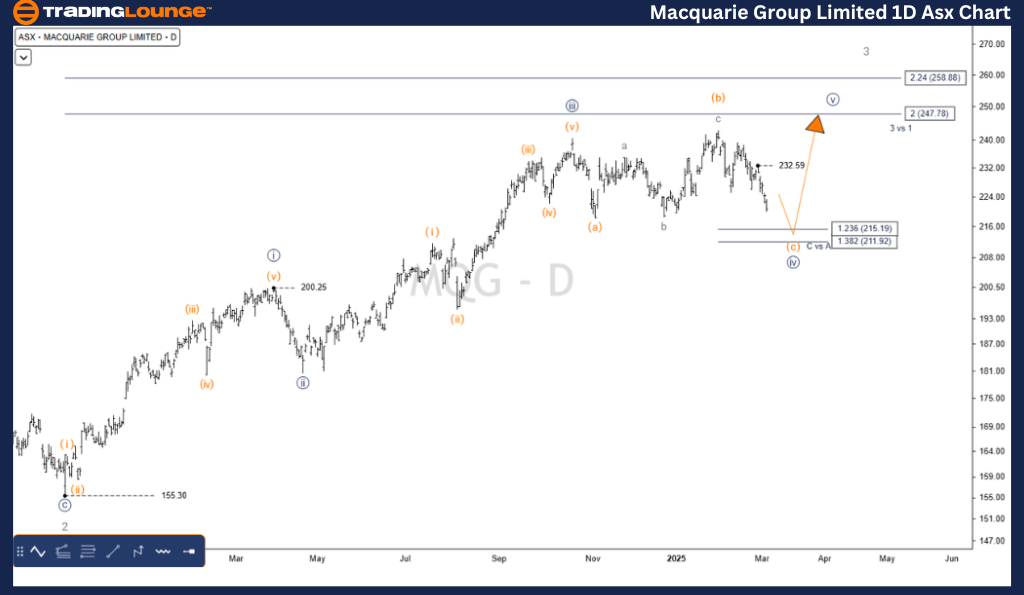
ASX: MQG 1D Chart (Semilog Scale) – Elliott Wave Analysis

Function: Major Trend (Minute Degree, Navy)

Mode: Motive

Structure: Impulse

Position: Wave v-grey of Wave (c)-orange of Wave ((iv))-navy

Analysis:

  • Wave ((iii))-navy recently concluded with a five-wave structure.
  • Wave ((iv))-navy is unfolding as a Flat (a)-(b)-(c) formation (orange).
  • Wave (c)-orange remains in progress, targeting 211.92 or slightly lower.
  • A break above 232.59 would serve as the first signal that Wave ((v))-navy is initiating an upward move.

Key Levels:

  • Invalidation Point: The end of Wave (b)-orange.
  • Confirmation Point: 232.590.

MACQUARIE-GROUP-1d-a...


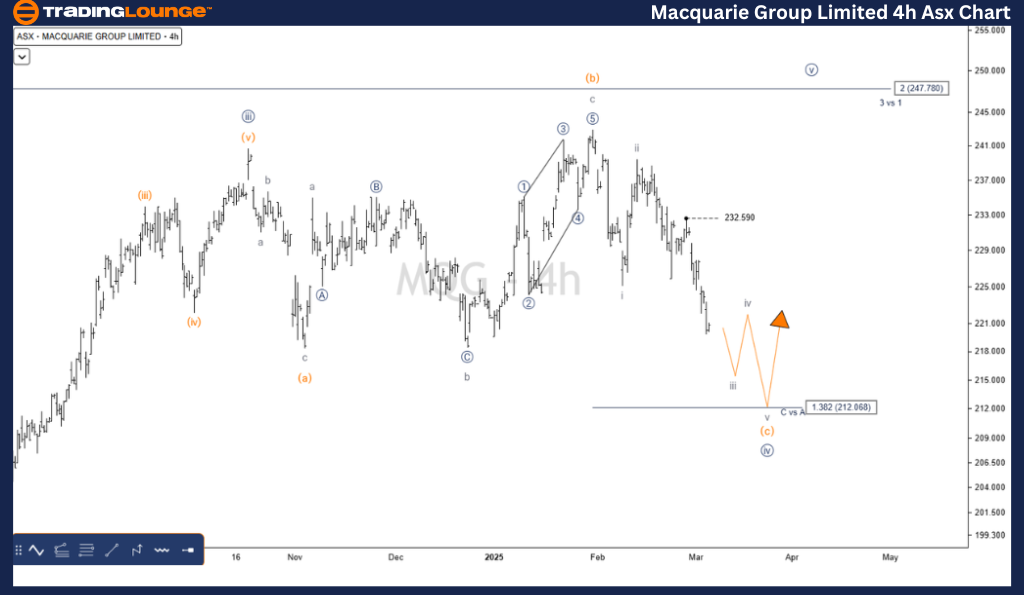
ASX: MQG 4H Chart – Elliott Wave Analysis

Function: Major Trend (Minute Degree, Navy)

Mode: Motive

Structure: Impulse

Position: Wave v-grey of Wave (c)-orange of Wave ((iv))-navy

Analysis:

  • No significant changes observed on the 4-hour timeframe.
  • Wave (c)-orange maintains its five-wave formation, labeled i-grey to v-grey, continuing its downward movement.

Key Levels:

  • Invalidation Point: The end of Wave (b)-orange.
  • Confirmation Point: 232.590.

Technical Analyst: Hua (Shane) Cuong, CEWA-M (Master’s Designation).

Source: visit Tradinglounge.com and learn From the Experts Join TradingLounge Here 

See Previous: ASX LIMITED Elliott Wave Technical Analysis

VALUE Offer - Buy 1 Month & Get 3 Months!Click here

Access 7 Analysts Over 200 Markets Covered. Chat Room With Support

MACQUARIE-GROUP-4h-a...


Conclusion

Our Elliott Wave analysis for ASX: Macquarie Group Limited (MQG) provides a clear technical outlook on the current market structure. By pinpointing crucial price levels, traders can enhance their decision-making strategies.

The analysis remains objective and data-driven, ensuring a professional assessment of ASX-listed stocks.

Related

Elliott Wave Analysis for Fortescue Metals Group (ASX: FMG): Stock Forecast, Price Targets, Trading Levels, and Market Trends

Elliott Wave Analysis for Fortescue Metals Group (ASX: FMG): Stock Forecast, Price Targets, Trading Levels, and Market Trends

Elliott Wave analysis for Fortescue Metals Group (ASX: FMG) highlights potential bullish trends, key...

Read More >
Elliott Wave Technical Analysis for State Bank of India (SBI) Stock: Predicting Future Price Movements and Key Trading Levels

Elliott Wave Technical Analysis for State Bank of India (SBI) Stock: Predicting Future Price Movements and Key Trading Levels

This article provides a comprehensive Elliott Wave analysis of State Bank of India (SBI) stock. It c...

Read More >
GBPUSD Forex Elliott Wave Analysis: Expert Insights on Technical Trends, Invalidation Levels, and Ongoing Price Action

GBPUSD Forex Elliott Wave Analysis: Expert Insights on Technical Trends, Invalidation Levels, and Ongoing Price Action

This article provides a detailed GBPUSD Elliott Wave analysis for both daily and 4-hour charts. It h...

Read More >
NZDUSD Elliott Wave Analysis with Bullish Forecast, Wave Count Structure, and Forex Trading Strategies Explained

NZDUSD Elliott Wave Analysis with Bullish Forecast, Wave Count Structure, and Forex Trading Strategies Explained

Elliott Wave analysis of the NZDUSD pair, highlighting bullish momentum on both the daily and 4-hour...

Read More >
Elliott Wave Analysis for NASDAQ 100 & Tech Stocks: Insights & Strategies for NDX, SP500, and Major Companies

Elliott Wave Analysis for NASDAQ 100 & Tech Stocks: Insights & Strategies for NDX, SP500, and Major Companies

This summary provides a comprehensive Elliott Wave analysis of the NASDAQ 100 (NDX) and major techno...

Read More >
Market Indices in Focus: Elliott Wave Analysis and Trade Strategy Amid S&P 500 Decline

Market Indices in Focus: Elliott Wave Analysis and Trade Strategy Amid S&P 500 Decline

The S&P 500 saw its biggest drop since August as U.S. manufacturing continued to contract for the fi...

Read More >

Buy 1 Month

Get 3 Months!

Special Offer:

Trade Recommendations

Unleash the power of deversified trading with our comprehensive portfolio, covering:

  • Stock Trades
  • Crypto Trades
  • Forex Trades
  • Commodity Trades
Elliott Wave Analysis

Gain a competive edge with expert insights in to:

  • Global Indices
  • US Stocks & ASX Stocks
  • Forex & Crypto
  • Commodities
Top-Notch Trading Tools

Equip yourself with the tools of success:

  • Social Chat
  • Elliott Wave Algorithm
  • Screener
  • TradingLevels
  • Trading Game
7 Elliott Wave Analysts

Stay ahead of the market with daily charts and insightful videos
-Your secret to strategic trading!

JOIN HERE


Welcome to TradingLounge (ASIC A.R.No. 321187), specialists in trades, trading education and technical analysis, covering stocks, indices, commodities, forex and cryptocurrencies.

When you join TradingLounge you have access to everything we offer, including trade tools, educational content and a social platform to chat with like-minded investors.

Read more

@Copyright 2024 by tradinglounge.com

Contact Us

Australian no: 02 4787 6020

International no: +61 (2) 47876020

Pay with:

Find us on