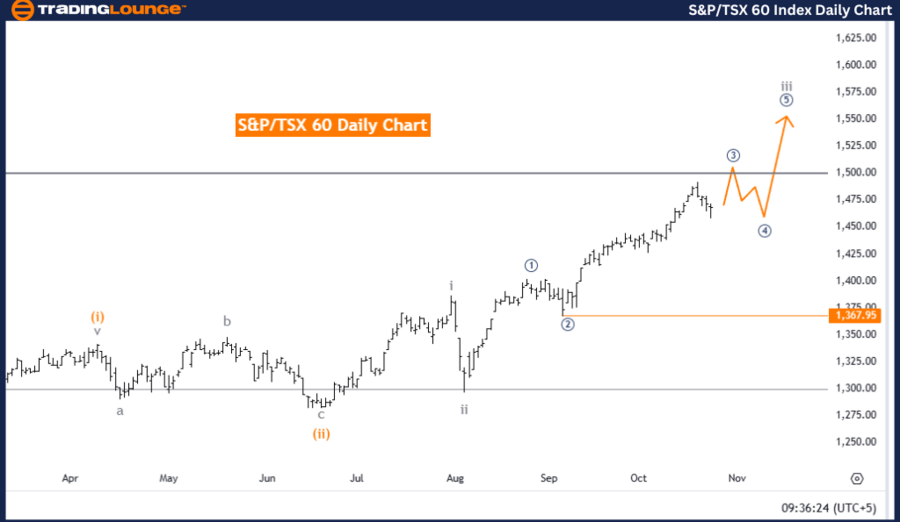
S&P/TSX 60 Elliott Wave Analysis - Trading Lounge Day Chart
Instrument: S&P/TSX 60 - Day Chart
Analysis Type: S&P/TSX 60 Elliott Wave Technical Analysis
Trend: Bullish
Mode: Impulsive
Wave Structure: Micro Navy Blue Wave 3
Position: Gray Wave 3
Next Lower Degree Direction: Micro Navy Blue Wave 4
Details: Micro navy blue wave 2 of 3 has completed; micro navy blue wave 3 of 3 is active.
Wave Cancel Level: 1,367.95
S&P/TSX 60 Day Chart Analysis Summary
The Elliott Wave analysis of the S&P/TSX 60 Day Chart points to a bullish trend within an impulsive wave formation, emphasizing the ongoing advance of micro navy blue wave 3. Positioned in gray wave 3, this stage reflects sustained bullish momentum, supported by the impulsive phase's drive. The completion of micro navy blue wave 2 of 3 indicates the start of micro navy blue wave 3 of 3, marking an intensified movement in the broader upward trend.
Transitioning from micro navy blue wave 2 to wave 3 suggests amplified buying activity, characteristic of the third wave in impulsive Elliott Wave structures. This stage often sees increased trading volume and rapid price gains, enhancing the positive outlook for the S&P/TSX 60 index at this time.
The next phase is expected to move toward micro navy blue wave 4, where a temporary corrective pullback may occur once the impulsive wave concludes. This aligns with Elliott Wave principles, highlighting a balance between impulsive and corrective waves. Once micro navy blue wave 3 completes, wave 4 could bring a minor consolidation or slight retracement before the potential continuation of the bullish trend.
The wave cancellation level is 1,367.95. Should prices drop below this point, it would invalidate the current wave count, prompting a reassessment of the trend direction and wave structure.
Summary of S&P/TSX 60 Day Chart Outlook
To summarize, the S&P/TSX 60 remains in a bullish trend within an impulsive wave framework, presently advancing through micro navy blue wave 3 of 3. This phase signals a strong upward trend, with a possible wave 4 correction. The wave structure is valid unless prices fall below the 1,367.95 level.
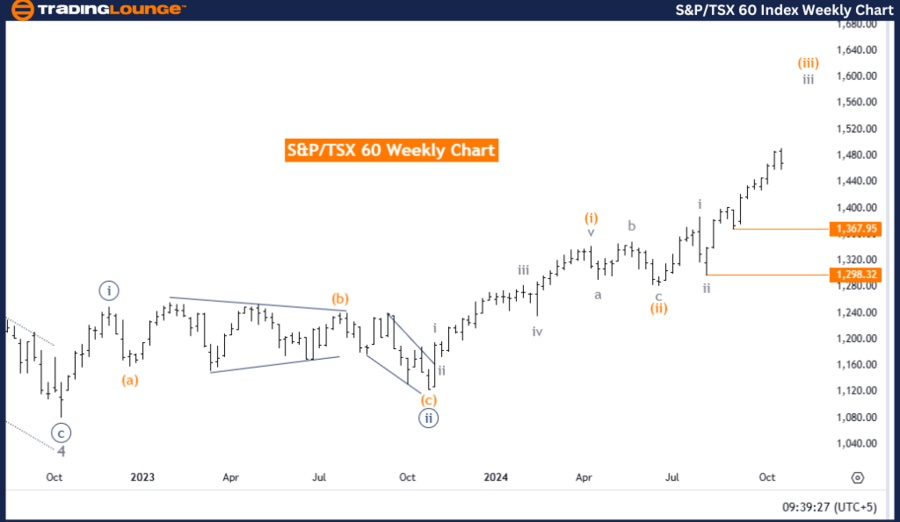
S&P/TSX 60 Elliott Wave Analysis - Trading Lounge Weekly Chart
Instrument: S&P/TSX 60 - Weekly Chart
Analysis Type: Elliott Wave Technical Analysis
Trend: Bullish
Mode: Impulsive
Wave Structure: Gray Wave 3
Position: Orange Wave 3
Next Lower Degree Direction: Gray Wave 4
Details: Gray wave 2 of 3 is complete; gray wave 3 of 3 is active.
Wave Cancel Level: 1,298.32
S&P/TSX 60 Weekly Chart Analysis Summary
The S&P/TSX 60 Weekly Chart Elliott Wave analysis signals a bullish trend within an impulsive wave structure, spotlighting gray wave 3’s progression. Positioned within orange wave 3, this wave suggests a consistent upward trajectory as it advances through gray wave 3’s impulsive phase. With gray wave 2 of 3 complete, the transition into gray wave 3 of 3 typically points to a period of strong buying momentum, aligning with Elliott Wave fundamentals.
The shift from gray wave 2 to gray wave 3 reflects increased bullish sentiment, typical in the third wave of an impulsive Elliott Wave pattern. This phase generally sees intensified price gains and trading volume, reinforcing the existing upward trend. As gray wave 3 unfolds, further upward potential remains likely before any significant pullback.
Following gray wave 3’s completion, the anticipated phase is gray wave 4, representing a corrective pullback within the Elliott Wave sequence. This alternation between impulsive and corrective waves implies a possible minor retracement after gray wave 3, allowing market consolidation before a potential upward continuation.
The wave cancellation level is 1,298.32. A price dip below this threshold would invalidate the current wave count, necessitating a reassessment of the bullish outlook and wave structure.
Summary of S&P/TSX 60 Weekly Chart Outlook
In conclusion, the S&P/TSX 60 index is currently in a bullish trend within an impulsive structure, advancing through gray wave 3 of 3. This phase represents strong upward movement, with the wave structure intact unless prices fall below the 1,298.32 cancellation level.
Technical Analyst: Malik Awais
Source: visit Tradinglounge.com and learn From the Experts Join TradingLounge Here
Previous: CAC 40 Elliott Wave Technical Analysis
VALUE Offer - Buy 1 Month & Get 3 Months!Click here
Access 7 Analysts Over 200 Markets Covered. Chat Room With Support