20Feb

Gold (XAUUSD) Elliott Wave Technical Analysis: Navigating Waves and Patterns for Market Insight

Gold Elliott Wave Technical Analysis - 20 February 24

Gold Elliott Wave Analysis 

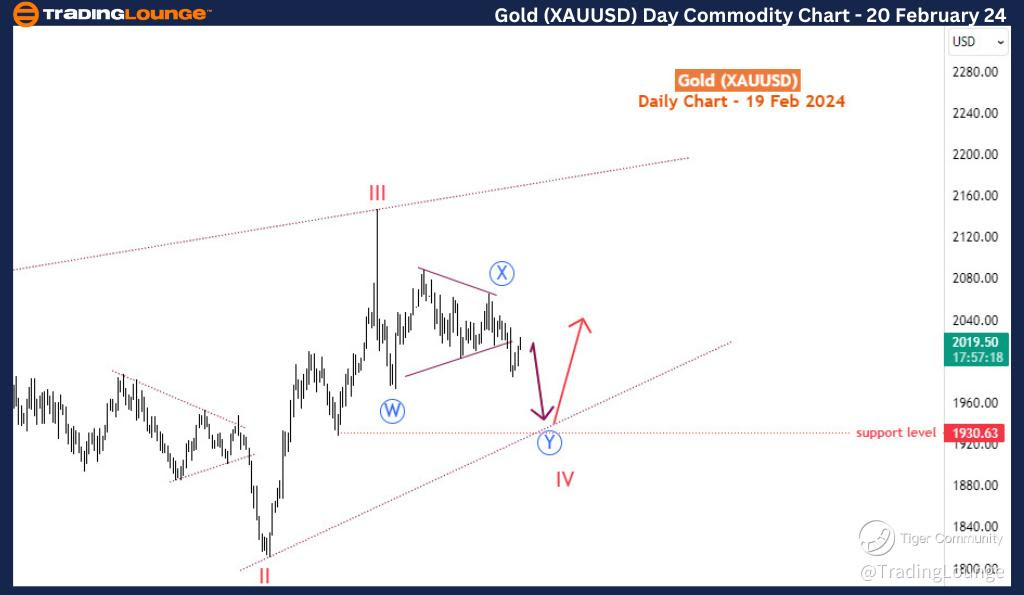
Gold (XAUUSD) Daily Time Frame

On the daily time frame, the current Elliott Wave analysis for gold suggests that we are witnessing what could be a zigzag pattern - blue wave Y after blue wave X completed with a triangle pattern at 2044. In a larger scope, we are observing the development of Blue Wave Y into a probable zigzag within the context of a larger Red Wave IV of a diagonal.

Gold-XAUUSD-day-Comm...


Gold (XAUUSD) 4-hour Time Frame

On the 4-hour time frame, blue Wave Y is still unfolding, with recent price action indicating a continuation of this wave. Notably, Wave (E) of the triangle within Blue Wave X concluded around the $2044 mark. Following this, there was a breakdown below the low of Wave (D) which stood at $2014, signaling the initiation of Blue Wave Y.

Gold-XAUUSD-4H-Commo...

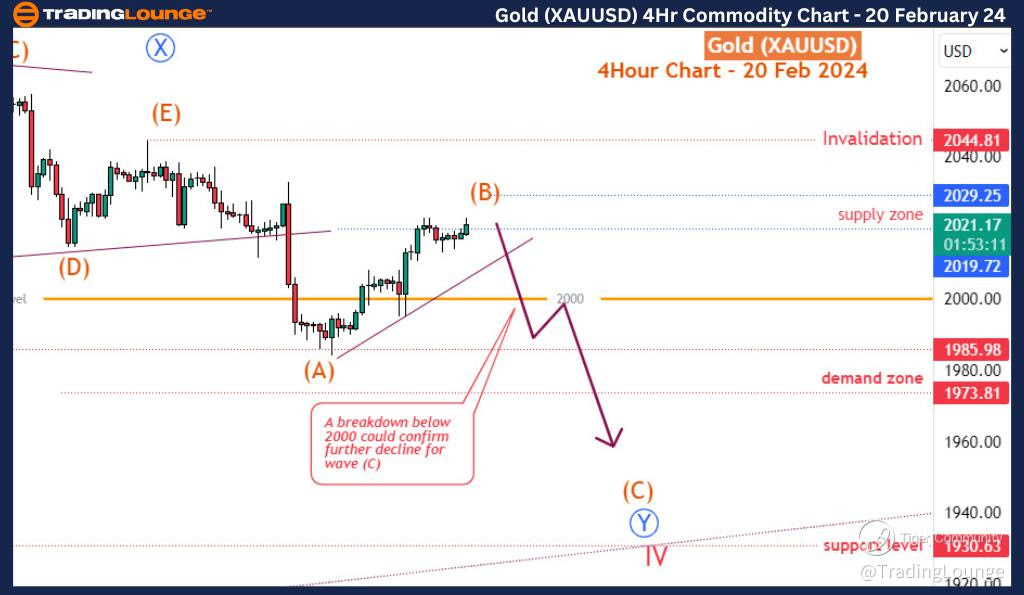
Currently, our attention is focused on the progression of Red Wave (A)-(B)-(C) which are sub-waves of blue Y. This phase appears to be unfolding as a three-wave zigzag pattern, with the wave (B) ascending into the 2019-2029 supply zone. It's important to note that the structure's invalidation level lies at $2044.8 where blue wave X terminated. Therefore, maintaining vigilance around this level is crucial as a breach could signify a shift in the expected wave count.

However, the preferred count suggests that should the bears regain control within the aforementioned supply zone, resulting in a sharp decline below $2000 (a major level), the probability of Red Wave (C) coming into play increases significantly. In such a scenario, prices could potentially dip below the 1985-1973 demand zone, indicating a deeper correction.

In summary, the Elliott Wave analysis for gold indicates that we are currently witnessing a corrective phase within the broader context of Red Wave IV. While Blue Wave Y is still in progress, attention is focused on its sub-waves of Y i.e red wave (A)-(B)-(C), with Wave (B) currently ascending into a key zone. However, traders and analysts must remain vigilant, as a breach of key levels could lead to a reassessment of the wave count and potential shifts in market dynamics.

Technical Analyst: Sanmi Adeagbo

Source: visit Tradinglounge.com and learn From the Experts Join TradingLounge Here 

See Previous: SoyBean


Related

In-Depth Cocoa Elliott Wave Analysis: Accurate Price Forecasts, Market Trends, and Commodity Trading Strategies

In-Depth Cocoa Elliott Wave Analysis: Accurate Price Forecasts, Market Trends, and Commodity Trading Strategies

Explore our detailed Cocoa Elliott Wave Analysis to stay ahead in the commodity market. Learn about ...

Read More >
Understanding of ChainLink Crypto Price News through LINKUSD Elliott Wave Technical Analysis

Understanding of ChainLink Crypto Price News through LINKUSD Elliott Wave Technical Analysis

Gain a thorough understanding of ChainLink (LINKUSD) through Elliott Wave analysis. This guide provi...

Read More >
Understand the key Signals and Patterns in Gold's Market Movement: Gold (XAUUSD) Commodity Elliott Wave Analysis

Understand the key Signals and Patterns in Gold's Market Movement: Gold (XAUUSD) Commodity Elliott Wave Analysis

This article provides a comprehensive Gold Elliott Wave analysis, covering gold price predictions, m...

Read More >
XRP Price Prediction: Elliott Wave Signals Bullish Breakout to $3.88 with Key Fibonacci Zones for Swing Trade Opportunities

XRP Price Prediction: Elliott Wave Signals Bullish Breakout to $3.88 with Key Fibonacci Zones for Swing Trade Opportunities

Analyse XRP's Elliott Wave setup with forecasts showing a bullish breakout to $3.88. Includes Fi...

Read More >
Mastercard (MA) Elliott Wave Technical Analysis: Is a Big Move Coming? Stock Forecast & Trading Insights! Examining Charts

Mastercard (MA) Elliott Wave Technical Analysis: Is a Big Move Coming? Stock Forecast & Trading Insights! Examining Charts

This Elliott Wave analysis of Mastercard Inc. (MA) provides a detailed technical forecast, examining...

Read More >

$1 for 2 Weeks

then $29 a month!

What a Special Offer!

Trade Recommendations

Unleash the power of deversified trading with our comprehensive portfolio, covering 250+ markets:

  • Stock Trades
  • Crypto Trades
  • Forex Trades
  • Commodity Trades
Elliott Wave Analysis

Gain a competitive edge with expert insights and AI-powered Elliott Wave charting into:

  • Global Indices
  • US Stocks & ASX Stocks
  • Forex & Crypto
  • Commodities
Top-Notch Trading Tools

Equip yourself with the tools of success:

  • Real-time Chat rooms
  • Elliott Wave Algorithm
  • Portfolio tools
  • TradingLevels
  • Screener
  • Trading Game
7 Elliott Wave Analysts

Stay ahead of the market with daily charts and insightful videos
Your secret to strategic trading!

JOIN HERE


Welcome to TradingLounge (ASIC A.R.No. 321187), specialists in trades, trading education and technical analysis, covering stocks, indices, commodities, forex and cryptocurrencies.

When you join TradingLounge you have access to everything we offer, including trade tools, educational content and a social platform to chat with like-minded investors.

Read more

@Copyright 2024 by tradinglounge.com

Contact Us

Australian no: 02 4787 6020

International no: +61 (2) 47876020

Pay with:

Find us on