24Mar

Theta Token (THETAUSD) Elliott Wave Analysis: Bullish Reversal Setup and Key Trading Zones

Theta/ U.S. Dollar (THETAUSD) Elliott Wave Analysis – TradingLounge Daily Chart

THETAUSD Elliott Wave Technical Analysis

Function: Counter-Trend

Mode: Corrective

Structure: Zigzag

Position: Wave C

Direction of Next Higher Degree: —

Wave Cancel Invalid Level: —

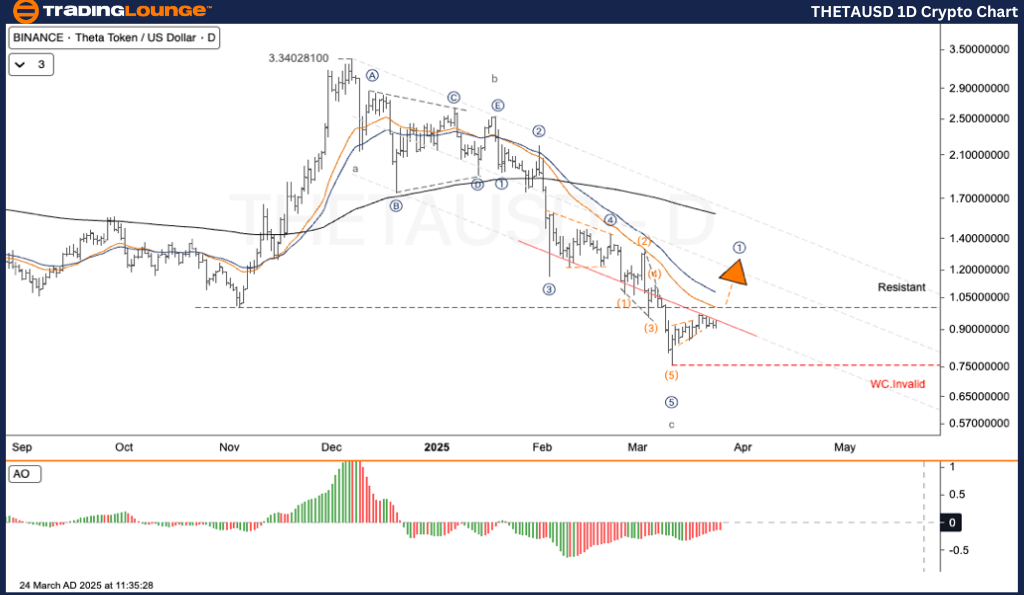
THETAUSD Daily Chart Trading Strategy

THETA is currently displaying a textbook a-b-c Elliott Wave correction. Wave c likely completed near $0.7595, where a bounce has initiated. This rebound suggests potential accumulation, indicating a possible trend reversal. The upcoming resistance area is between $1.00 and $1.15. Within wave c, five internal waves have completed, supporting the start of wave ① and signaling the potential for a new upward phase.

  • Key Resistance Zone: $1.00 – $1.15

            A successful breakout and close above this range may confirm the start of a stronger bullish trend.

Short-Term Trading Plan (Swing Traders)

✅ Monitor price action for a confirmed breakout above $1.00 – $1.15 before entering long positions.

Risk Management

  • Critical Support: $0.76 (Prior Swing Low)

If the price declines below $0.76, the current corrective structure may become invalid.

THETAUSD-1d-crypto-c...


Theta/ U.S. Dollar (THETAUSD) Elliott Wave Analysis – TradingLounge H4 Chart

THETAUSD Elliott Wave Technical Analysis

Function: Counter-Trend

Mode: Corrective

Structure: Zigzag

Position: Wave C

Direction of Next Higher Degree: —

Wave Cancel Invalid Level: —

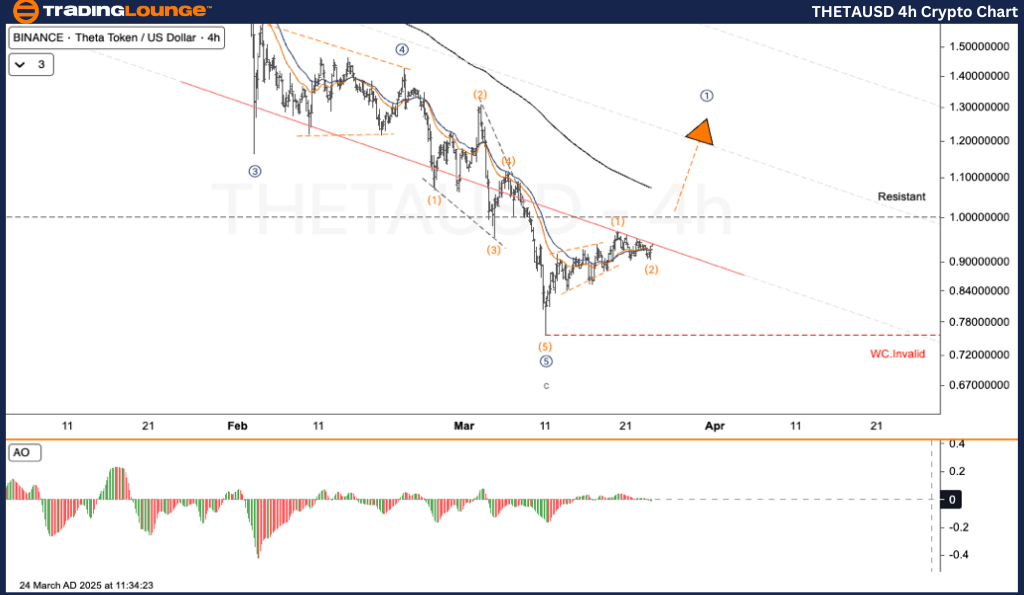
THETAUSD H4 Chart Trading Strategy

The 4-hour chart aligns with the daily outlook, confirming an a-b-c corrective wave pattern. Wave c appears to have bottomed at $0.7595, from which a recovery is now underway. Price is testing resistance between $1.00 and $1.15. Sub-waves inside wave c have completed, which may signal that wave ① is beginning a new upward cycle.

  • Resistance to Watch: $1.00 – $1.15

           A breakout beyond this level could confirm bullish momentum continuation.

Swing Trade Strategy

✅ Wait for a strong confirmation above the $1.00 – $1.15 zone before executing long trades.

Risk Management

  • Support Level: $0.76

A close below this level could negate the bullish Elliott Wave setup.

Technical Analyst: Kittiampon Somboonsod

Source: Visit Tradinglounge.com and learn from the Experts. Join TradingLounge Here 

Previous: BTCUSD Elliott Wave Technical Analysis

VALUE Offer - Buy 1 Month & Get 3 Months!Click here

Access 7 Analysts Over 200 Markets Covered. Chat Room With Support

THETAUSD-4h-crypto-c...

Related

WIPRO Stocks Elliott Wave Technical Analysis: Learn How Wave Counts and Projections Can Guide Your Trading Decisions

WIPRO Stocks Elliott Wave Technical Analysis: Learn How Wave Counts and Projections Can Guide Your Trading Decisions

This article dives into the Elliott Wave analysis of Wipro, providing a comprehensive breakdown of i...

Read More >
Comprehensive Stock Market Indices Analysis: S&P 500, NASDAQ 100, RUSSELL 2000, DAX 40, FTSE 100, ASX 200 | Elliott Wave Insights

Comprehensive Stock Market Indices Analysis: S&P 500, NASDAQ 100, RUSSELL 2000, DAX 40, FTSE 100, ASX 200 | Elliott Wave Insights

The S&P 500 and NASDAQ 100 are currently in a bullish Elliott Wave pattern, specifically in wave (ii...

Read More >
KOSPI Composite Index Elliott Wave Technical Analysis: Indicates a Strong Bullish Trend with Significant Investment Potential

KOSPI Composite Index Elliott Wave Technical Analysis: Indicates a Strong Bullish Trend with Significant Investment Potential

The latest Elliott Wave analysis on the KOSPI Composite Index indicates a strong bullish trend with ...

Read More >
U.S. Dollar/Swiss Franc (USDCHF) Forex Elliott Wave Technical Analysis: Detailed market insights and potential price movements

U.S. Dollar/Swiss Franc (USDCHF) Forex Elliott Wave Technical Analysis: Detailed market insights and potential price movements

This article provides a comprehensive analysis of the USDCHF currency pair using Elliott Wave Theory...

Read More >
Elliott Wave Analysis & Trading Strategies: S&P 500, NASDAQ 100, DAX 40, FTSE 100, ASX 200 – TradingLounge Insights

Elliott Wave Analysis & Trading Strategies: S&P 500, NASDAQ 100, DAX 40, FTSE 100, ASX 200 – TradingLounge Insights

Explore our expert Elliott Wave trading strategies for the SP500, NASDAQ 100. Our analysis highlight...

Read More >

Buy 1 Month

Get 3 Months!

Special Offer:

Trade Recommendations

Unleash the power of deversified trading with our comprehensive portfolio, covering:

  • Stock Trades
  • Crypto Trades
  • Forex Trades
  • Commodity Trades
Elliott Wave Analysis

Gain a competive edge with expert insights in to:

  • Global Indices
  • US Stocks & ASX Stocks
  • Forex & Crypto
  • Commodities
Top-Notch Trading Tools

Equip yourself with the tools of success:

  • Social Chat
  • Elliott Wave Algorithm
  • Screener
  • TradingLevels
  • Trading Game
7 Elliott Wave Analysts

Stay ahead of the market with daily charts and insightful videos
-Your secret to strategic trading!

JOIN HERE


Welcome to TradingLounge (ASIC A.R.No. 321187), specialists in trades, trading education and technical analysis, covering stocks, indices, commodities, forex and cryptocurrencies.

When you join TradingLounge you have access to everything we offer, including trade tools, educational content and a social platform to chat with like-minded investors.

Read more

@Copyright 2024 by tradinglounge.com

Contact Us

Australian no: 02 4787 6020

International no: +61 (2) 47876020

Pay with:

Find us on