S&P BSE SENSEX NEXT 50 – Elliott Wave Analysis – Trading Lounge Day Chart
S&P BSE SENSEX NEXT 50 Wave Technical Analysis | Daily Elliott Wave Forecast
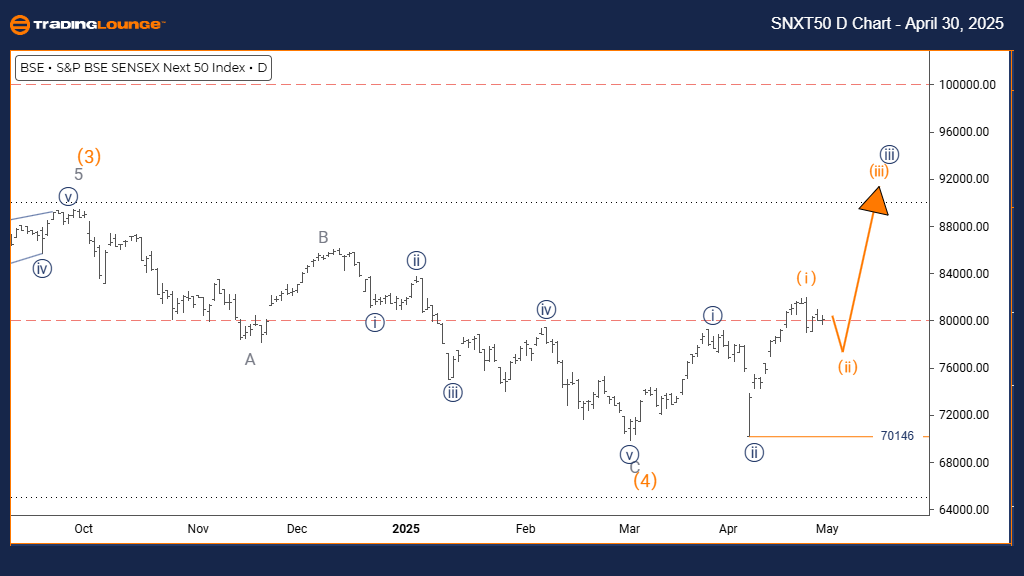
FUNCTION: Counter Trend
MODE: Corrective
STRUCTURE: Orange Wave 2
POSITION: Navy Blue Wave 3
DIRECTION NEXT HIGHER DEGREES: Orange Wave 3
DETAILS: Orange wave 1 appears complete; orange wave 2 is currently developing.
Wave Cancel/Invalid Level: 70146
The S&P BSE SENSEX NEXT 50 daily Elliott Wave chart highlights a counter-trend correction occurring within a broader bullish structure. After the completion of orange wave 1, the market is now forming orange wave 2, positioned within a rising navy blue wave 3 trend. This scenario suggests a short-term consolidation before the bullish momentum resumes.
Orange wave 2 represents a typical Elliott Wave correction, commonly retracing 38% to 61% of wave 1’s advance. These patterns often unfold as zigzags or flats, characterized by overlapping price action and weaker momentum. On the daily chart, this corrective phase is consistent with wave 2 behavior, signaling a healthy pause in the prevailing uptrend.
Following the completion of wave 2, we anticipate the emergence of orange wave 3, which often brings the strongest gains in an impulsive wave sequence—likely surpassing the high of wave 1. A key level to monitor remains 70146; a move below this would invalidate the current bullish scenario.
Traders should remain alert for signs of wave 2 completion, including bullish reversal patterns, oversold technical readings, and volume accumulation. This phase could offer high-probability entry points ahead of the projected wave 3 rally. Technical indicators will be crucial in confirming the beginning of the next bullish impulse.
This consolidation phase provides an opportunity for traders to position themselves strategically. Watching for price reactions at Fibonacci retracement levels will be important for identifying potential breakout points as the index transitions from wave 2 into wave 3.
S&P BSE SENSEX NEXT 50 – Elliott Wave Analysis – Trading Lounge Weekly Chart
S&P BSE SENSEX NEXT 50 Wave Technical Analysis | Weekly Elliott Wave Forecast
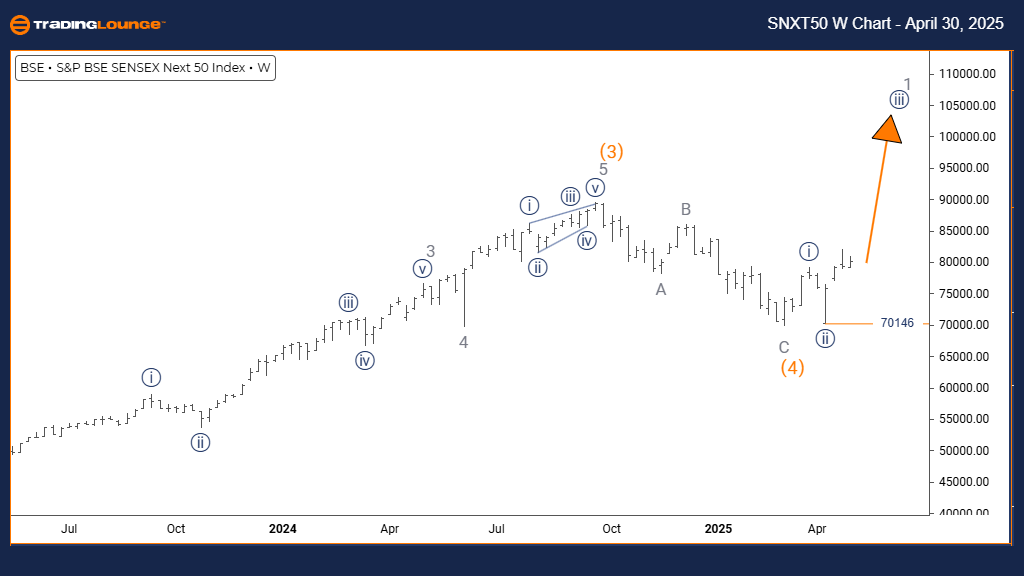
FUNCTION: Bullish Trend
MODE: Impulsive
STRUCTURE: Navy Blue Wave 3
POSITION: Gray Wave 1
DIRECTION NEXT LOWER DEGREES: Navy Blue Wave 4
DETAILS: Navy blue wave 2 is likely completed; navy blue wave 3 is active.
Wave Cancel/Invalid Level: 70146
The S&P BSE SENSEX NEXT 50 weekly Elliott Wave analysis presents a robust bullish impulsive trend in progress, driven by navy blue wave 3 within a broader gray wave 1 framework. The completion of navy blue wave 2 marks the beginning of this powerful third wave, typically recognized as the strongest in the Elliott Wave cycle.
Wave 3 is often the core rally phase, characterized by strong momentum, large price gains, and broad market participation. This wave is expected to extend beyond wave 1, supporting the outlook of an accelerating bullish trend. The current structure implies a sustained advance unless price falls below 70146, which would invalidate the bullish wave count.
From a higher timeframe perspective, the development of navy blue wave 3 within gray wave 1 signals a larger uptrend forming, possibly spanning multiple timeframes. This reinforces the bullish sentiment and the significance of current market strength.
Investors should look for classic wave 3 traits: rising volume, positive momentum, and trend continuation signals. Maintaining positions through this wave is generally favorable for trend-following strategies, particularly as the move gains traction.
Upon the conclusion of wave 3, a corrective navy blue wave 4 is expected, offering a breather before the next impulse. For now, wave 3 presents compelling trading opportunities, supporting a bullish outlook in both medium and long-term forecasts.
Technical Analyst: Malik Awais
Source: Visit Tradinglounge.com and learn from the Experts. Join TradingLounge Here
Previous: NIKKEI 225 (N225) Index Elliott Wave Technical Analysis
VALUE Offer - Buy 1 Month & Get 3 Months!Click here
Access 7 Analysts Over 200 Markets Covered. Chat Room With Support