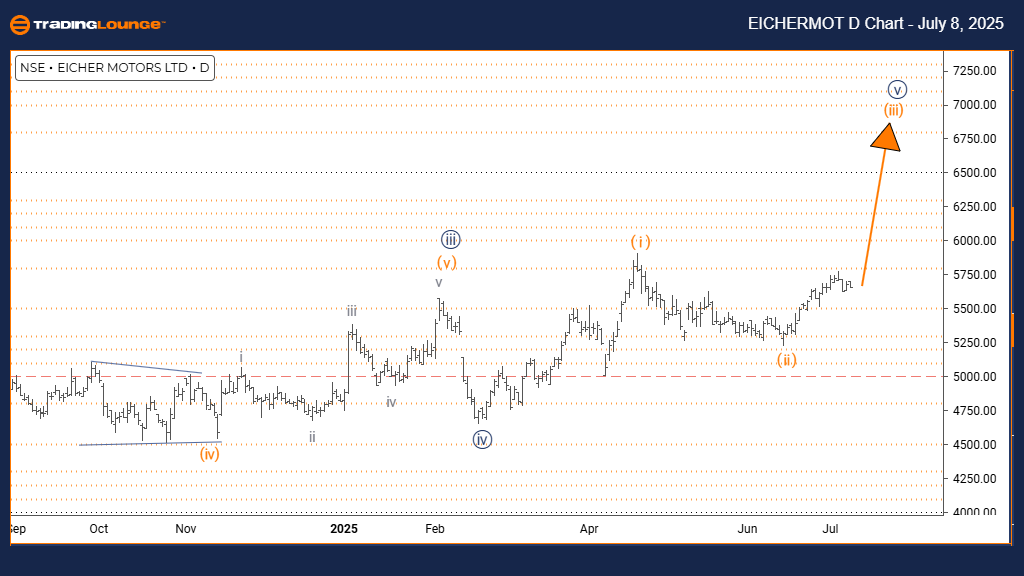
EICHER MOTORS Elliott Wave Analysis | Trading Lounge Day Chart
EICHER MOTORS Elliott Wave Technical Analysis
FUNCTION: Bullish Trend
MODE: Impulsive
STRUCTURE: Orange Wave 3
POSITION: Navy Blue Wave 5
DIRECTION (Next Lower Degree): Orange Wave 4
DETAILS:
Orange wave 2 appears to have ended. The current wave development is now likely within orange wave 3 or extending into navy blue wave 5.
The Eicher Motors daily chart indicates a firm bullish trend as interpreted through Elliott Wave analysis. The chart structure confirms an impulsive move, showcasing sustained upward momentum. Current wave identification places the stock in orange wave 3, evolving inside navy blue wave 5. This configuration implies the likelihood of short-term gains in the Eicher Motors share price.
Completion of orange wave 2 supports the initiation of the next leg—either orange wave 3 or navy blue wave 5. This confirms strong upside potential in the ongoing trend. The impulsive structure reflects investor confidence and continued buying strength.
Investors and traders may consider this a positive signal, anticipating further price increases. After orange wave 3 concludes, a temporary corrective move in orange wave 4 is expected. Despite this, the overarching navy blue wave 5 structure indicates bullish continuity, potentially driving new price highs.
This wave count provides a positive Elliott Wave forecast for Eicher Motors. Key focus should remain on the progress of orange wave 3, as it will define forthcoming market moves. Traders should monitor this phase closely for strategic entry and exit positions. Provided the impulsive pattern stays valid, upward momentum is likely to persist. The anticipated orange wave 4 may offer a limited pullback before resumption of the trend.
SUMMARY:
Eicher Motors is currently moving within a bullish Elliott Wave pattern, showing strong momentum and rising share prices. A correction via orange wave 4 is expected later, but the overall stock market trend analysis remains bullish. Continued buying activity is supported by the ongoing impulsive structure.
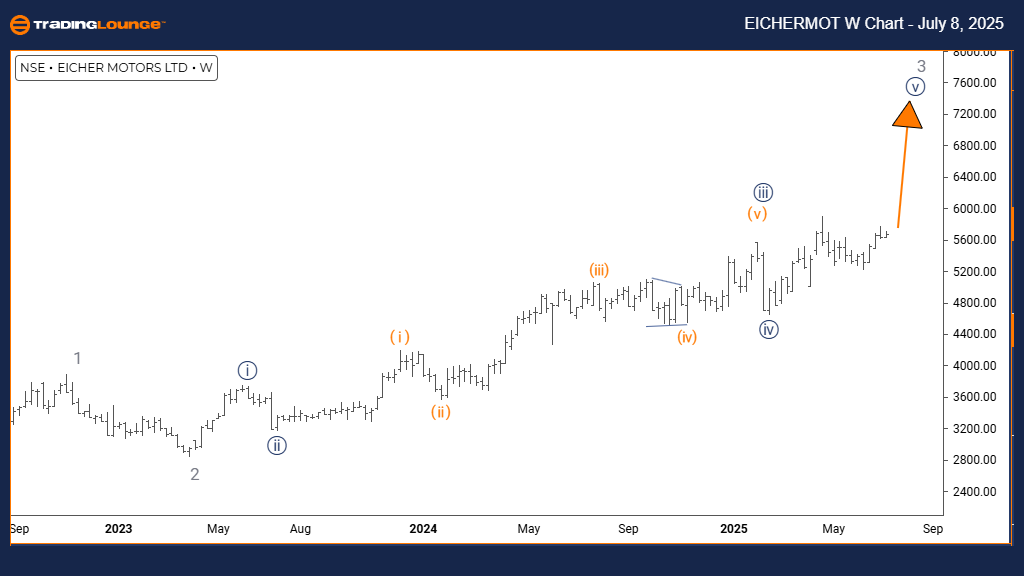
EICHER MOTORS Elliott Wave Analysis | Trading Lounge Weekly Chart
EICHER MOTORS Elliott Wave Technical Analysis
FUNCTION: Bullish Trend
MODE: Impulsive
STRUCTURE: Navy Blue Wave 5
POSITION: Gray Wave 3
DIRECTION (Next Lower Degree): Gray Wave 4
DETAILS:
Navy blue wave 4 seems completed. The stock appears to be advancing into navy blue wave 5 within gray wave 3.
The weekly chart for Eicher Motors sustains a bullish Elliott Wave trend, confirming long-term upside potential. The impulsive wave mode suggests continued buying interest and upward momentum. Present wave analysis places the move in navy blue wave 5, forming within gray wave 3, which reflects additional upside prospects.
Completion of navy blue wave 4 paves the way for navy blue wave 5, supporting sustained gains. This ongoing trend validates the strength of the bullish phase. As long as the impulsive structure holds, the Eicher Motors stock is expected to advance further.
Traders may interpret this as evidence of ongoing bullish sentiment, forecasting further price appreciation before any notable pullback. Once navy blue wave 5 finalizes, a corrective move in gray wave 4 could emerge. This phase may offer an opportunity for strategic accumulation.
The key driver of current price movement is the development of navy blue wave 5 within gray wave 3. Tracking this wave is essential for timing trades effectively. The impulsive nature underlines a robust market pattern driven by active investor interest.
SUMMARY:
Eicher Motors continues to display a bullish wave pattern on the weekly timeframe. With navy blue wave 4 likely completed, navy blue wave 5 points to potential new highs. A future gray wave 4 correction is expected, yet the prevailing trend suggests continued upward movement. Close monitoring of wave formations is recommended for tactical trading decisions.
Technical Analyst: Malik Awais
Source: Visit Tradinglounge.com and learn from the Experts. Join TradingLounge Here
Previous: ASIAN PAINT Elliott Wave Technical Analysis
VALUE Offer - Buy 1 Month & Get 3 Months!Click here
Access 7 Analysts Over 200 Markets Covered. Chat Room With Support