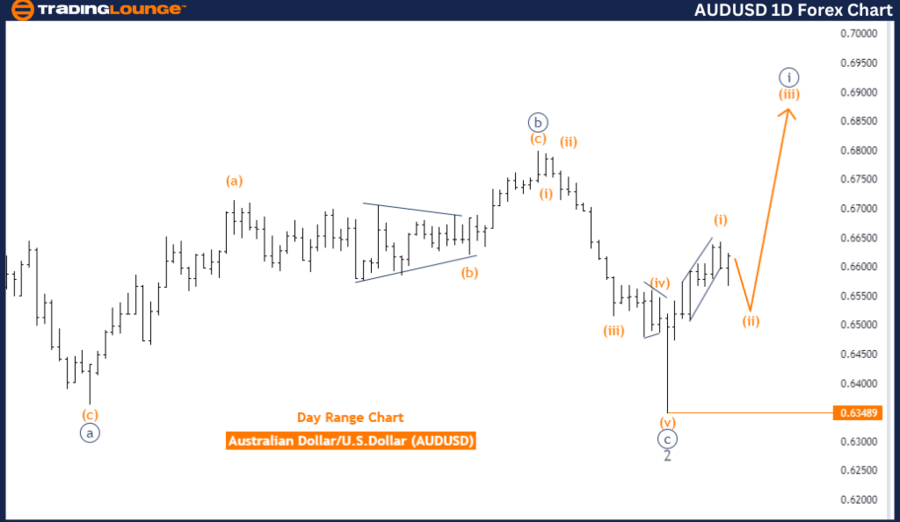
AUDUSD Elliott Wave Analysis: Trading Lounge Day Chart
Australian Dollar/U.S. Dollar (AUDUSD) Day Chart Analysis
AUDUSD Elliott Wave Technical Analysis
Function: Trend
Mode: Impulsive
Structure: Navy Blue Wave 1
Position: Gray Wave 3
Direction Next Higher Degrees: Navy Blue Wave 1 (Continues)
Details: Gray Wave 2 appears to be complete; Navy Blue Wave 1 of 3 is currently in progress.
Wave Cancel Invalid Level: 0.63489
The AUDUSD daily chart indicates a trend movement, analyzed through Elliott Wave theory, currently in an impulsive mode. The structure under review is Navy Blue Wave 1, which marks the beginning phase of a broader impulsive wave. This stage is characterized by a strong directional movement, in line with the overall trend.
Currently, the market is positioned within Gray Wave 3, which is a part of the larger Navy Blue Wave 1 structure. The apparent completion of Gray Wave 2 suggests that the market has ended its corrective phase and is now advancing in the impulsive wave of Navy Blue Wave 1. This pattern aligns with Elliott Wave theory, where the market typically resumes its trend direction with increased momentum after a correction.
The higher degree trend remains consistent with Navy Blue Wave 1, indicating that the market is expected to continue its current trajectory, progressing further within the impulsive wave structure. The conclusion of Gray Wave 2 and the initiation of Navy Blue Wave 1 of 3 suggest that the market is in the early stages of a potentially significant trend movement.
A critical level to monitor is the wave cancel invalid level at 0.63489. If the market breaches this level, the current wave count would be invalidated, signaling a potential shift in the trend or an alternative wave structure.
In summary, the AUDUSD daily chart is in an impulsive mode, currently within Gray Wave 3, part of Navy Blue Wave 1. The completion of Gray Wave 2 indicates a continuation of the trend, with Navy Blue Wave 1 of 3 now in progress. The wave cancel invalid level at 0.63489 is crucial for confirming this analysis.
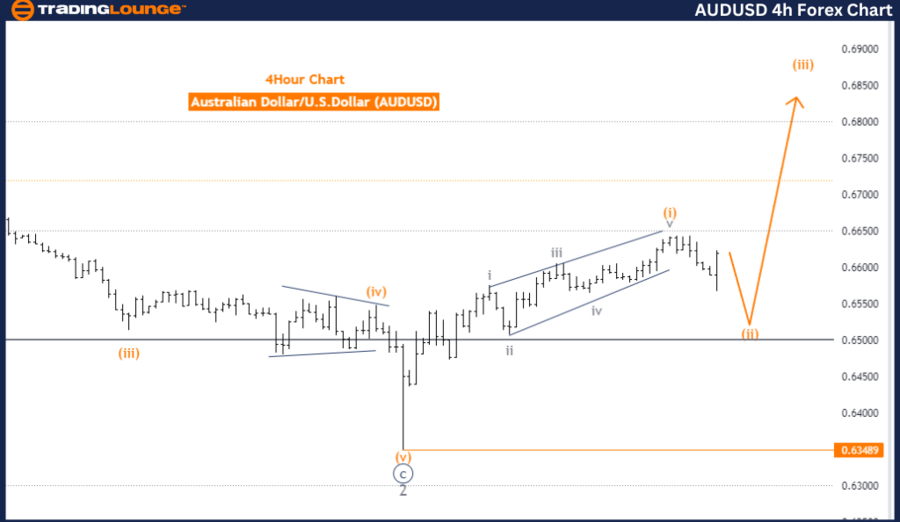
AUDUSD Elliott Wave Analysis: Trading Lounge 4-Hour Chart
Australian Dollar/U.S. Dollar (AUDUSD) 4-Hour Chart Analysis
AUDUSD Elliott Wave Technical Analysis
Function: Counter Trend
Mode: Corrective
Structure: Orange Wave 2
Position: Navy Blue Wave 1
Direction Next Higher Degrees: Orange Wave 3
Details: Orange Wave 1 appears complete; Orange Wave 2 is currently in play.
Wave Cancel Invalid Level: 0.63489
The AUDUSD 4-hour chart is experiencing a counter-trend movement based on Elliott Wave analysis. The market is currently in a corrective mode, characterized by a temporary move against the primary trend. This phase is identified as Orange Wave 2, indicating that the market is retracing or correcting the previous impulsive move of Orange Wave 1.
The structure in focus is Orange Wave 2, following the completion of Orange Wave 1. The completion of Orange Wave 1 indicates that the initial phase of the downtrend has concluded, and the market is now correcting that move through Orange Wave 2. This scenario is typical in Elliott Wave analysis, where after a significant move in one direction, the market tends to pull back before resuming its primary trend.
Currently, the market is positioned within Navy Blue Wave 1, a smaller degree wave within the larger Orange Wave 2 structure. This positioning suggests that the market is in the early stages of the corrective phase and could see further movement as this wave completes.
The higher degree trend is expected to follow Orange Wave 3. Once the correction of Orange Wave 2 is complete, the market is anticipated to resume its primary trend with Orange Wave 3, typically representing a strong and decisive movement in the direction of the overall trend, indicating a continuation of the downtrend.
A critical level to observe is the wave cancel invalid level at 0.63489. If the market breaches this level, the current wave count would be invalidated, suggesting that the corrective phase has either ended or is taking a different form than initially anticipated.
In conclusion, the AUDUSD is currently in a corrective phase identified as Orange Wave 2, following the completion of Orange Wave 1. The market is positioned within Navy Blue Wave 1, with the expectation of resuming the downtrend in Orange Wave 3 after the correction is complete. The wave cancel invalid level at 0.63489 is key to confirming this analysis.
Technical Analyst: Malik Awais
Source: visit Tradinglounge.com and learn From the Experts Join TradingLounge Here
Previous: USDCHF Elliott Wave Technical Analysis
Special Trial Offer - 0.76 Cents a Day for 3 Months! Click here
Access 7 Analysts Over 170 Markets Covered. Chat Room With Support