COAL INDIA LTD – COALINDIA (1D Chart) Elliott Wave Technical Analysis

COALINDIA  Elliott Wave Technical Analysis

Function: Counter Trend Lower (Minor Degree, Grey)

Mode: Corrective

Structure: Potential Impulse within Larger Degree Correction

Position: Lower Degree Waves are Unfolding, Not Yet Marked

Details: Based on recent analysis, the alternative count has now become the preferred scenario, suggesting a potential top around 550, marking the termination of Intermediate Wave (5) in Orange. The stock is trending downward, unfolding as a potential impulse toward the 400-405 range. A detailed update on the wave count will follow in the coming week.

Invalidation Point: 550

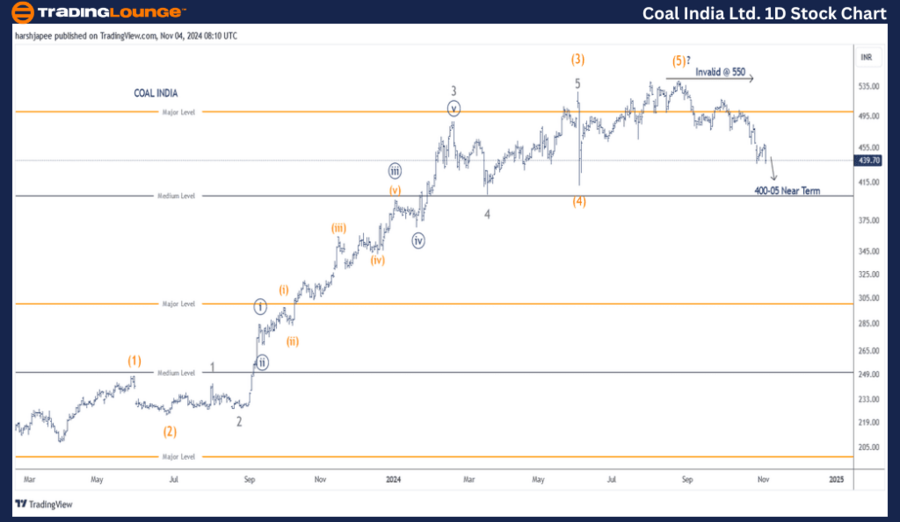
COAL INDIA Daily Chart Technical Analysis and Potential Elliott Wave Counts:

The daily chart of COAL INDIA suggests that a larger degree uptrend concluded near the 550 mark, aligning with Intermediate Wave (5) recorded on August 26, 2024. If this analysis holds, the stock may undergo a significant correction from the 550 high. The initial impulse wave could find support near the 400 level in the short term.

The stock has completed a five-wave rally following a drop near the 210 lows in March 2023. Note that Intermediate Wave (3) experienced an extension, as did Minor Wave 3 within it. Intermediate Wave (4) in Orange represented a sharp correction to 412, recorded on June 4, 2024.

Assuming the above structure is accurate, COAL INDIA has now shifted lower into a larger corrective wave, with price action expected to remain below the 550 level.

Coal-Indian-Ltd-1D-S...


COAL INDIA LTD – COALINDIA (4H Chart) Elliott Wave Technical Analysis

Function: Counter Trend Lower (Minor Degree, Grey)

Mode: Corrective

Structure: Potential Impulse within Larger Degree Correction

Position: Lower Degree Waves are Unfolding, Not Yet Marked

Details: As per the alternative count, now the preferred view, a potential top has formed around 550, marking the end of Intermediate Wave (5) in Orange. The stock's downtrend appears to be unfolding as a potential impulse toward the 400-405 target range. Minute Wave ((iii)) of a possible Minor Wave 1 could be forming, or the price is completing Wave C in an A-B-C corrective pattern.

Invalidation Point: 550

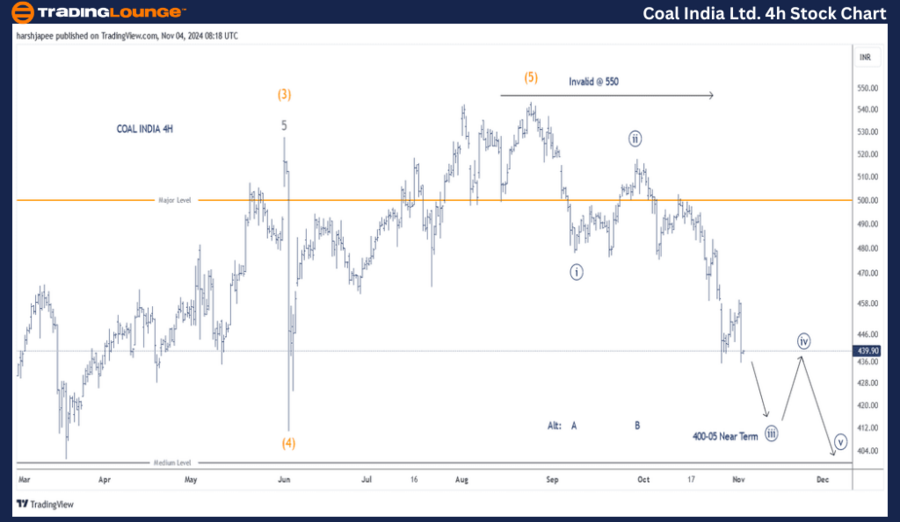
COAL INDIA 4H Chart Technical Analysis and Potential Elliott Wave Counts:

The 4H chart for COAL INDIA showcases the sub-waves following the peak at 550, marking Intermediate Wave (5) in Orange. Currently, Minute Wave ((iii)) of Minor Wave 1 appears to be heading toward the 400-405 range, which aligns with the termination of the previous Wave (4).

Alternatively, the decline from 550 may be taking shape as an A-B-C correction, with the last segment moving lower toward the 400-405 level.


Technical Analyst: Harsh Japee

Source: visit Tradinglounge.com and learn From the Experts Join TradingLounge Here 

Previous: State Bank of India Elliott Wave Technical Analysis 

VALUE Offer - Buy 1 Month & Get 3 Months!Click here

Access 7 Analysts Over 200 Markets Covered. Chat Room With Support

Coal-Indian-Ltd-4h-S...


Conclusion:

COAL INDIA appears to be progressing through its first impulse decline since the 550 high, or it could be completing Wave C within an A-B-C corrective structure, with an anticipated target around the 400 mark.

Related

Commodities & Futures Market Analysis: Elliott Wave Insights & Strategies

Commodities & Futures Market Analysis: Elliott Wave Insights & Strategies

Discover profitable opportunities in the Commodities and Futures Trading Market with our comprehen...

Read More >
Examining CRM's price movements using daily and 4-hour charts: Salesforce Inc. (CRM) Stocks Elliott Wave Technical Analysis

Examining CRM's price movements using daily and 4-hour charts: Salesforce Inc. (CRM) Stocks Elliott Wave Technical Analysis

Discover our latest Elliott Wave analysis for Salesforce Inc. (CRM), thoroughly examining CRM's ...

Read More >
Understanding of ChainLink Crypto Price News through LINKUSD Elliott Wave Technical Analysis

Understanding of ChainLink Crypto Price News through LINKUSD Elliott Wave Technical Analysis

Gain a thorough understanding of ChainLink (LINKUSD) through Elliott Wave analysis. This guide provi...

Read More >
Euro/British Pound Forex trading and improve your strategy with accurate EURGBP Elliott Wave forecasts and signals

Euro/British Pound Forex trading and improve your strategy with accurate EURGBP Elliott Wave forecasts and signals

This comprehensive EURGBP Elliott Wave analysis provides a detailed look into the market’s current ...

Read More >
Unlocking ASX Trading Success: RESMED INC - RMD Stock Analysis & Elliott Wave Technical Forecast

Unlocking ASX Trading Success: RESMED INC - RMD Stock Analysis & Elliott Wave Technical Forecast

This detailed analysis of ASX-listed ResMed Inc (RMD) stock offers insights into current market tren...

Read More >
New Zealand Dollar/ U.S. Dollar (NZDUSD) Elliott Wave Analysis Predicts Bearish Drop After Ongoing Correction on Daily and 4-Hour Charts

New Zealand Dollar/ U.S. Dollar (NZDUSD) Elliott Wave Analysis Predicts Bearish Drop After Ongoing Correction on Daily and 4-Hour Charts

NZDUSD Elliott Wave Analysis Predicts Bearish Drop After Ongoing Correction on Daily and 4-Hour Char...

Read More >

$1 for 2 Weeks

then $29 a month!

What a Special Offer!

Trade Recommendations

Unleash the power of deversified trading with our comprehensive portfolio, covering 250+ markets:

  • Stock Trades
  • Crypto Trades
  • Forex Trades
  • Commodity Trades
Elliott Wave Analysis

Gain a competitive edge with expert insights and AI-powered Elliott Wave charting into:

  • Global Indices
  • US Stocks & ASX Stocks
  • Forex & Crypto
  • Commodities
Top-Notch Trading Tools

Equip yourself with the tools of success:

  • Real-time Chat rooms
  • Elliott Wave Algorithm
  • Portfolio tools
  • TradingLevels
  • Screener
  • Trading Game
7 Elliott Wave Analysts

Stay ahead of the market with daily charts and insightful videos
Your secret to strategic trading!

JOIN HERE


Welcome to TradingLounge (ASIC A.R.No. 321187), specialists in trades, trading education and technical analysis, covering stocks, indices, commodities, forex and cryptocurrencies.

When you join TradingLounge you have access to everything we offer, including trade tools, educational content and a social platform to chat with like-minded investors.

Read more

@Copyright 2024 by tradinglounge.com

Contact Us

Australian no: 02 4787 6020

International no: +61 (2) 47876020

Pay with:

Find us on