USDCHF Elliott Wave Analysis - Trading Lounge
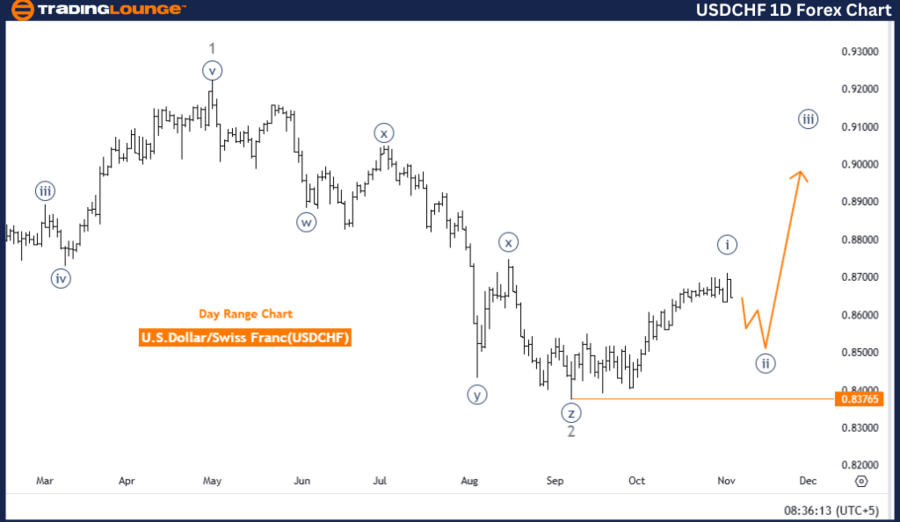
U.S. Dollar / Swiss Franc (USDCHF) - Daily Chart
USDCHF Elliott Wave Technical Analysis
Function: Counter Trend
Mode: Corrective
Structure: Navy Blue Wave 2
Position: Gray Wave 3
Next Higher Degree Direction: Navy Blue Wave 3
Details: Completion of Navy Blue Wave 1; Navy Blue Wave 2 is underway.
Wave Invalidation Level: 0.83765
The USDCHF daily chart’s Elliott Wave analysis indicates a counter-trend corrective pattern, with a focus on Navy Blue Wave 2 following the completed impulsive Navy Blue Wave 1. This corrective movement, labeled Wave 2, signifies a temporary consolidation or pullback within the overall bullish trend. Currently positioned in Gray Wave 3, this structure represents a pullback phase that allows the market to adjust before potentially resuming its primary direction.
According to Elliott Wave theory, corrective waves such as Navy Blue Wave 2 often present short-term counter-trends, which pause or retrace from the main trend direction. Upon completion, the primary trend is expected to resume, projecting an upward momentum aligned with Navy Blue Wave 3 in line with the initial direction of Wave 1.
The invalidation level for this wave structure is set at 0.83765. Should the price fall below this point, it would invalidate the current wave structure, suggesting a possible shift from the expected pattern. However, if the price stays above this level, the corrective wave remains valid, supporting a transition into Navy Blue Wave 3 and the broader bullish outlook.
This analysis underscores the importance of Navy Blue Wave 2 in setting the stage for the next phase. Assuming the corrective phase completes without crossing the invalidation level, it signals the potential for the next impulsive move, consistent with the larger Navy Blue Wave 3. This outlook hints at further upward movement post-consolidation, dependent on confirmation at the wave cancel level.
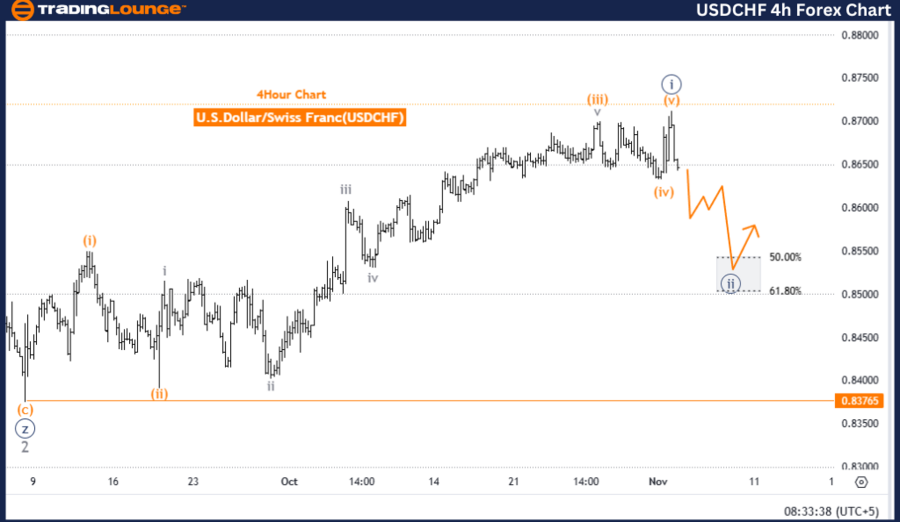
U.S. Dollar / Swiss Franc (USDCHF) - 4-Hour Chart
USDCHF Elliott Wave Technical Analysis
Function: Counter Trend
Mode: Corrective
Structure: Navy Blue Wave 2
Position: Gray Wave 3
Next Higher Degree Direction: Navy Blue Wave 3
Details: Navy Blue Wave 1 has concluded; Navy Blue Wave 2 remains active.
Wave Invalidation Level: 0.83765
On the 4-hour chart, the USDCHF Elliott Wave analysis displays a counter-trend corrective pattern, where Navy Blue Wave 2 is unfolding after the completion of Navy Blue Wave 1. This structure suggests a consolidation phase that may precede the next wave in the primary trend.
Gray Wave 3 sits within this corrective Navy Blue Wave 2, indicating potential sideways or pullback movements typically seen in corrective phases. Elliott Wave theory implies that these corrective waves act as a counterbalance to the dominant trend, providing a period for retracement or consolidation in preparation for the next impulsive phase.
The anticipated higher-degree move is Navy Blue Wave 3, which is projected to resume the primary trend following this corrective stage. This progression would align with the upward direction established in Navy Blue Wave 1, suggesting that Navy Blue Wave 2 serves as a setup phase for further trend continuation.
The wave cancel level at 0.83765 remains a critical threshold for this wave structure. A price movement below this point would invalidate the current wave count, indicating a potential deviation from the projected pattern. If the price sustains above this level, the validity of Navy Blue Wave 2 remains intact, leading to a potential transition into Navy Blue Wave 3 and a further bullish outlook following this corrective phase.
Technical Analyst: Malik Awais
Source: visit Tradinglounge.com and learn From the Experts Join TradingLounge Here
Previous: EURUSD Elliott Wave Technical Analysis
VALUE Offer - Buy 1 Month & Get 3 Months!Click here
Access 7 Analysts Over 200 Markets Covered. Chat Room With Support