11Feb

Costco Wholesale Corp. (COST) Elliott Wave Analysis: Stock Forecast, Key Resistance Levels, and Market Outlook for Investors

Costco Wholesale Corp. (COST) Elliott Wave Analysis

In this Elliott Wave analysis, we examine the trend structure of Costco Wholesale Corp. (COST) using both the daily and 1-hour charts. This assessment helps determine the current wave position and potential price movements based on Elliott Wave theory.


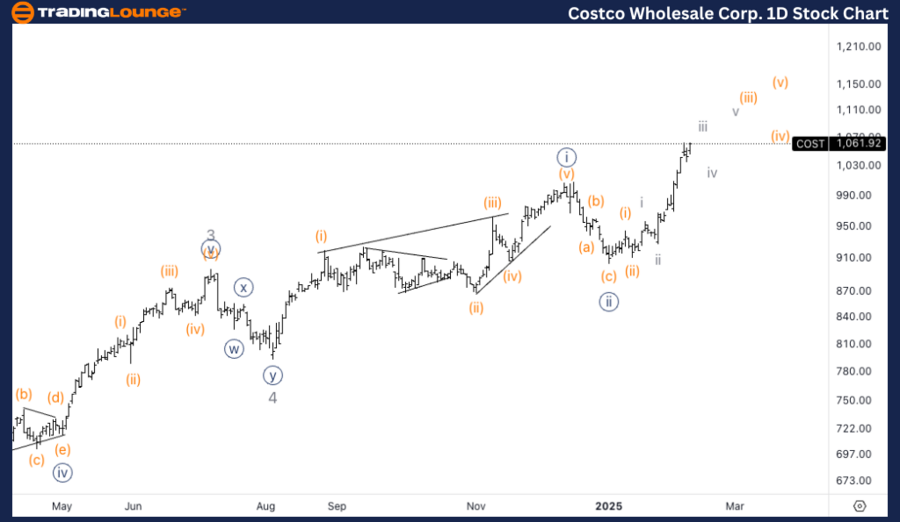
Costco Wholesale Corp. (COST) Elliott Wave Analysis – Trading Loung Daily Chart

COST Elliott Wave Technical Analysis

Function: Trend

Mode: Impulsive

Structure: Motive

Position: Wave {iii} of 5

Direction: Upside in wave 5

COST Elliott Wave Technical Analysis – Daily Chart

Costco Wholesale Corp. (COST) is currently extending within wave {iii} of 5, signaling further upside movement. The stock has broken above the key resistance at $1000, a critical level (TradingLevel1), confirming bullish momentum.

  • The next key target is $1150, where an equality relationship between wave {iii} and wave {i} is expected.
  • If the impulsive trend continues, higher price levels could be reached before a potential pullback in wave {iv}.
  • As long as support holds, the broader uptrend remains intact, reinforcing the bullish Elliott Wave count.

costco-1d-stock-char...


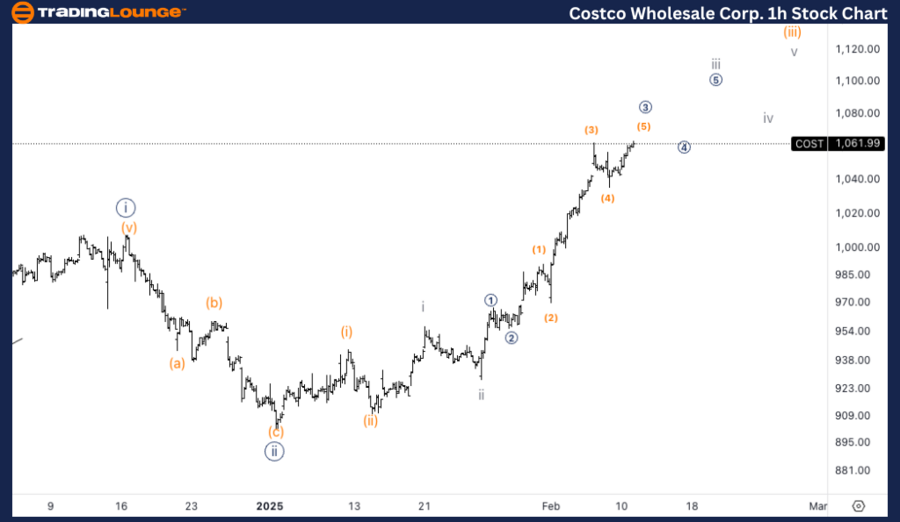
Costco Wholesale Corp. (COST) Elliott Wave Analysis – Trading Loung 1H Chart

COST Elliott Wave Technical Analysis

Function: Trend

Mode: Impulsive

Structure: Motive

Position: Wave iii of (iii)

Direction: Upside in wave {iii}

COST Elliott Wave Technical Analysis – 1H Chart

On the 1-hour chart, COST is progressing in wave iii of (iii), a strong third-wave extension that suggests a sharp upside move. The steep ascent angle supports the current Elliott Wave count, reinforcing the ongoing bullish trend.

  • The market is displaying a third-of-a-third wave extension, typically a powerful price acceleration phase.
  • Expect a series of smaller corrective waves (threes and fours) as the trend unfolds, maintaining upward momentum.
  • This structure indicates continuation to higher levels before a potential corrective move.

As long as momentum sustains, the bullish wave structure remains valid, with potential new highs forming within the Elliott Wave cycle.

Technical Analyst: Alessio Barretta

Source: visit Tradinglounge.com and learn From the Experts Join TradingLounge Here 

See Previous: Mastercard Inc. (MA) Elliott Wave Technical Analysis

VALUE Offer - Buy 1 Month & Get 3 Months!Click here

Access 7 Analysts Over 200 Markets Covered. Chat Room With Support

costco-1h-stock-char...

Related

ASX LIMITED Elliott Wave Analysis: ASX Stock Forecast, Impulse & Corrective Waves, and Market Trends Explained

ASX LIMITED Elliott Wave Analysis: ASX Stock Forecast, Impulse & Corrective Waves, and Market Trends Explained

ASX Elliott Wave analysis provides an in-depth look at ASX stock trends, price predictions, and tech...

Read More >
INFOSYS INFY Elliott Wave Analysis: Bearish Trend, Impulsive Structure, and Trading Strategy for Daily & Weekly Charts

INFOSYS INFY Elliott Wave Analysis: Bearish Trend, Impulsive Structure, and Trading Strategy for Daily & Weekly Charts

Infosys uses Elliott Wave theory to analyze the current market structure on both daily and weekly ch...

Read More >
Fortinet Inc. (FTNT) Wave 2 Bottom Nearing Completion, Breakout Above $100 Confirms Bullish Wave 3 Trend Setup

Fortinet Inc. (FTNT) Wave 2 Bottom Nearing Completion, Breakout Above $100 Confirms Bullish Wave 3 Trend Setup

Fortinet (FTNT) shows a completed wave 1 and ongoing wave 2 correction. A move above $100 confirms w...

Read More >
BANKS, AAPL, AMZN, NVDA, TSLA, GOOGL, META, NFLX, MSFT. Elliott Wave Insights & Strategies

BANKS, AAPL, AMZN, NVDA, TSLA, GOOGL, META, NFLX, MSFT. Elliott Wave Insights & Strategies

Nvidia and Meta Platforms will top in Primary Wave 1) in March 2024. They have a good few months for...

Read More >
AMCOR Stock Forecast: ASX AMC Starts Bullish Wave 3 After Corrective Zigzag – Elliott Wave Analysis, Price Targets, Trade Setups

AMCOR Stock Forecast: ASX AMC Starts Bullish Wave 3 After Corrective Zigzag – Elliott Wave Analysis, Price Targets, Trade Setups

AMCOR (ASX: AMC) completes a corrective wave and begins bullish Wave (3). Discover price targets, in...

Read More >
Theta Token (THETAUSD) Elliott Wave Analysis Reveals Bullish Setup With Wave 3 Breakout Potential and Strategic Buy Zone Entry

Theta Token (THETAUSD) Elliott Wave Analysis Reveals Bullish Setup With Wave 3 Breakout Potential and Strategic Buy Zone Entry

Elliott Wave analysis of THETAUSD, highlighting wave structures, technical patterns, and strategic e...

Read More >

$1 for 2 Weeks

then $29 a month!

What a Special Offer!

Trade Recommendations

Unleash the power of deversified trading with our comprehensive portfolio, covering 250+ markets:

  • Stock Trades
  • Crypto Trades
  • Forex Trades
  • Commodity Trades
Elliott Wave Analysis

Gain a competitive edge with expert insights and AI-powered Elliott Wave charting into:

  • Global Indices
  • US Stocks & ASX Stocks
  • Forex & Crypto
  • Commodities
Top-Notch Trading Tools

Equip yourself with the tools of success:

  • Real-time Chat rooms
  • Elliott Wave Algorithm
  • Portfolio tools
  • TradingLevels
  • Screener
  • Trading Game
7 Elliott Wave Analysts

Stay ahead of the market with daily charts and insightful videos
Your secret to strategic trading!

JOIN HERE


Welcome to TradingLounge (ASIC A.R.No. 321187), specialists in trades, trading education and technical analysis, covering stocks, indices, commodities, forex and cryptocurrencies.

When you join TradingLounge you have access to everything we offer, including trade tools, educational content and a social platform to chat with like-minded investors.

Read more

@Copyright 2024 by tradinglounge.com

Contact Us

Australian no: 02 4787 6020

International no: +61 (2) 47876020

Pay with:

Find us on