10May

Spotify Technology S.A. (SPOT) Stock Analysis: Elliott Wave Forecast Suggests Bullish Breakout

Spotify Technology S.A. (SPOT) Elliott Wave Analysis - TradingLounge Daily Chart

SPOT Elliott Wave Technical Analysis

FUNCTION: Trend

MODE: Impulsive

STRUCTURE: Motive

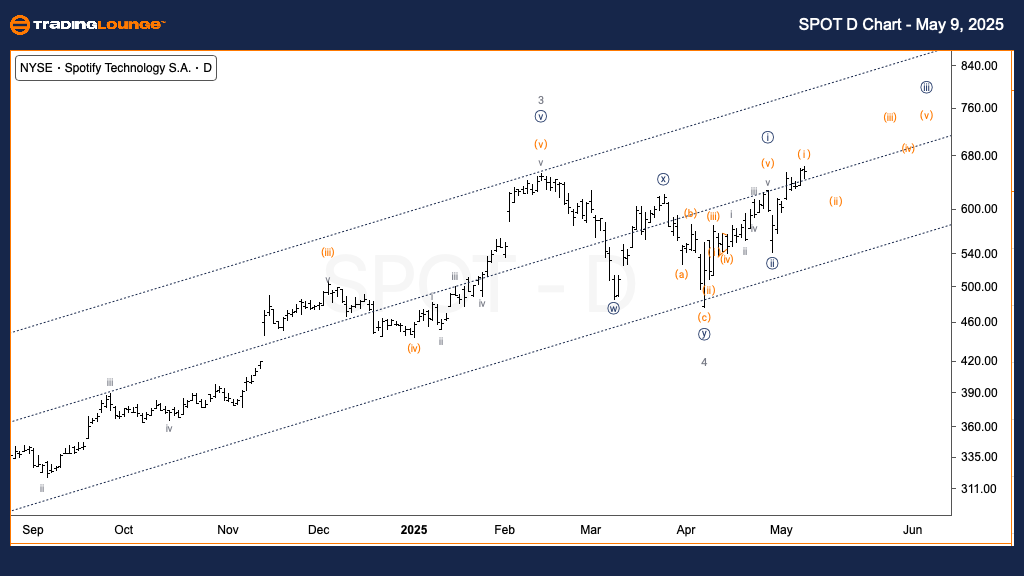
POSITION: Wave {iii} of 5

DIRECTION: Upside in wave {iii}

DETAILS: Wave 4 seems complete, setting the stage for upward momentum in wave {iii} of 5. A breakout above the key resistance at $650 would likely confirm the continuation of the bullish trend.

Daily Chart Analysis Overview
Spotify stock's daily Elliott Wave setup indicates a bullish continuation pattern. The completion of wave 4 aligns with the start of wave {iii} of 5—a typically aggressive leg in Elliott Wave structures. The $650 price zone is a key level to watch for validation.

A successful move above this level would confirm the uptrend and suggest additional gains in line with the projected wave count. Investors and technical traders focused on SPOT should monitor for signals pointing to this bullish scenario.

Spotify-d-us-stock-c...


Spotify Technology S.A. (SPOT) Elliott Wave Analysis - TradingLounge 1H Chart

SPOT Elliott Wave Technical Analysis

FUNCTION: Trend

MODE: Impulsive

STRUCTURE: Motive

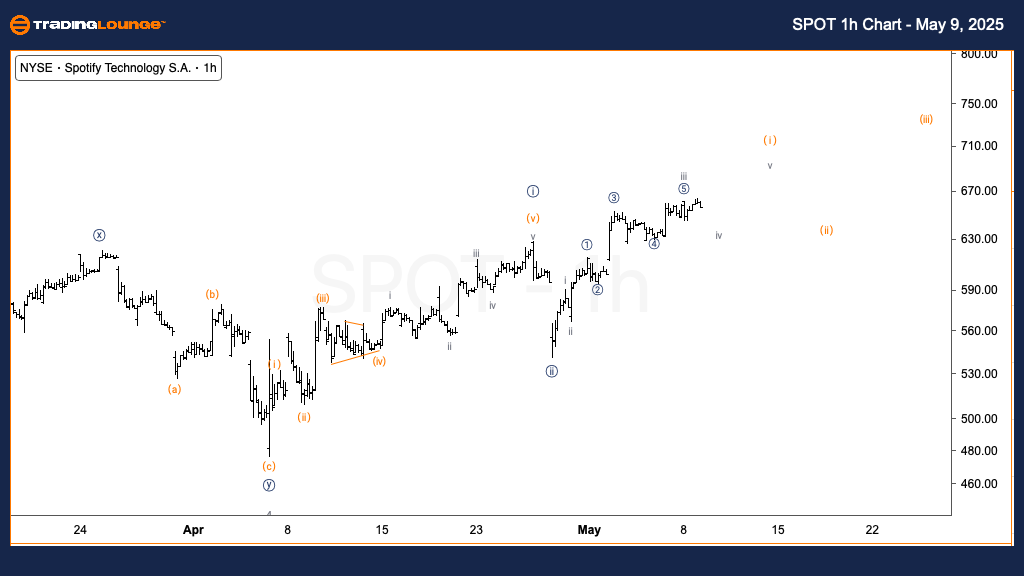
POSITION: Wave v of (i)

DIRECTION: Upside in wave (i)

DETAILS: On the hourly chart, the stock is progressing within wave {iii}. Current price movement may be part of wave (i) or continuing as part of wave {iii}. A higher extension would imply the development of wave {v}.

1-Hour Chart Summary
The intraday Elliott Wave analysis for Spotify supports the bullish outlook on the daily timeframe. Wave (i) of {iii} appears to be developing, with price action pointing to a potential match in length to wave {i}. A confirmed breakout could lead to wave {v}, pushing prices higher in the short term.

Technical traders analyzing SPOT should closely observe intraday momentum for signs of upward continuation and possible alignment with the larger trend.

Technical Analyst: Alessio Barretta

Source: Visit Tradinglounge.com and learn from the Experts. Join TradingLounge Here 

Previous: QUALCOMM Inc. (QCOM) Elliott Wave Technical Analysis

VALUE Offer - Buy 1 Month & Get 3 Months!Click here

Access 7 Analysts Over 200 Markets Covered. Chat Room With Support

Spotify-1h-us-stock-...


Conclusion
Across both the daily and hourly charts, Spotify (SPOT) stock displays signs of entering a fresh bullish cycle. Key confirmation lies near the $650 resistance level. A strong move beyond this point would reinforce the wave count and present strategic long entry opportunities in alignment with Elliott Wave principles.

Related

USDJPY Elliott Wave Technical Analysis Shows U.S. Dollar/Japanese Yen Forex Currency Pair is Currently in a Downward Trend Phase

USDJPY Elliott Wave Technical Analysis Shows U.S. Dollar/Japanese Yen Forex Currency Pair is Currently in a Downward Trend Phase

The USDJPY currency pair is currently in a downward trend phase according to Elliott Wave analysis. ...

Read More >
Discover How to leverage Elliott Wave Theory to make Informed Decisions about McDonald's Corp. Stock: MCD Elliott Wave analysis

Discover How to leverage Elliott Wave Theory to make Informed Decisions about McDonald's Corp. Stock: MCD Elliott Wave analysis

This article provides a detailed Elliott Wave analysis of McDonald's Corp. (MCD), focusing on ke...

Read More >
Costco Wholesale Corp. (COST) Elliott Wave Chart Signals Start of Bearish Wave C with Key Support Levels and Trade Setup Potential

Costco Wholesale Corp. (COST) Elliott Wave Chart Signals Start of Bearish Wave C with Key Support Levels and Trade Setup Potential

Costco’s stock appears to have completed wave (B) near $1000. Elliott Wave analysis suggests a bear...

Read More >
Eli Lilly & Co.(LLY:NYSE) Elliott Wave Technical Analysis 28 November 23

Eli Lilly & Co.(LLY:NYSE) Elliott Wave Technical Analysis 28 November 23

Eli Lilly & Co.(LLY:NYSE) Elliott Wave Technical Analysis dated 28 November 23 with 1-hour and 4-hou...

Read More >
Dogecoin Crypto Elliott Wave Technical Analysis: highlighting price predictions, technical trends, and trading strategies

Dogecoin Crypto Elliott Wave Technical Analysis: highlighting price predictions, technical trends, and trading strategies

This article provides a detailed Elliott Wave analysis for Dogecoin (DOGEUSD), highlighting price pr...

Read More >
Elliott Wave Analysis for Theta Token Against the U.S. Dollar (THETAUSD): A Comprehensive Daily and H4 Chart Review

Elliott Wave Analysis for Theta Token Against the U.S. Dollar (THETAUSD): A Comprehensive Daily and H4 Chart Review

This article provides an in-depth Elliott Wave analysis of Theta Token against the U.S. dollar (THET...

Read More >

Buy 1 Month

Get 3 Months!

Special Offer:

Trade Recommendations

Unleash the power of deversified trading with our comprehensive portfolio, covering:

  • Stock Trades
  • Crypto Trades
  • Forex Trades
  • Commodity Trades
Elliott Wave Analysis

Gain a competive edge with expert insights in to:

  • Global Indices
  • US Stocks & ASX Stocks
  • Forex & Crypto
  • Commodities
Top-Notch Trading Tools

Equip yourself with the tools of success:

  • Social Chat
  • Elliott Wave Algorithm
  • Screener
  • TradingLevels
  • Trading Game
7 Elliott Wave Analysts

Stay ahead of the market with daily charts and insightful videos
-Your secret to strategic trading!

JOIN HERE


Welcome to TradingLounge (ASIC A.R.No. 321187), specialists in trades, trading education and technical analysis, covering stocks, indices, commodities, forex and cryptocurrencies.

When you join TradingLounge you have access to everything we offer, including trade tools, educational content and a social platform to chat with like-minded investors.

Read more

@Copyright 2024 by tradinglounge.com

Contact Us

Australian no: 02 4787 6020

International no: +61 (2) 47876020

Pay with:

Find us on