14Mar

NEOUSD Elliott Wave Analysis: Detailed Price Forecast, Bullish Signals, and Market Trends for Informed Crypto Trading Decisions

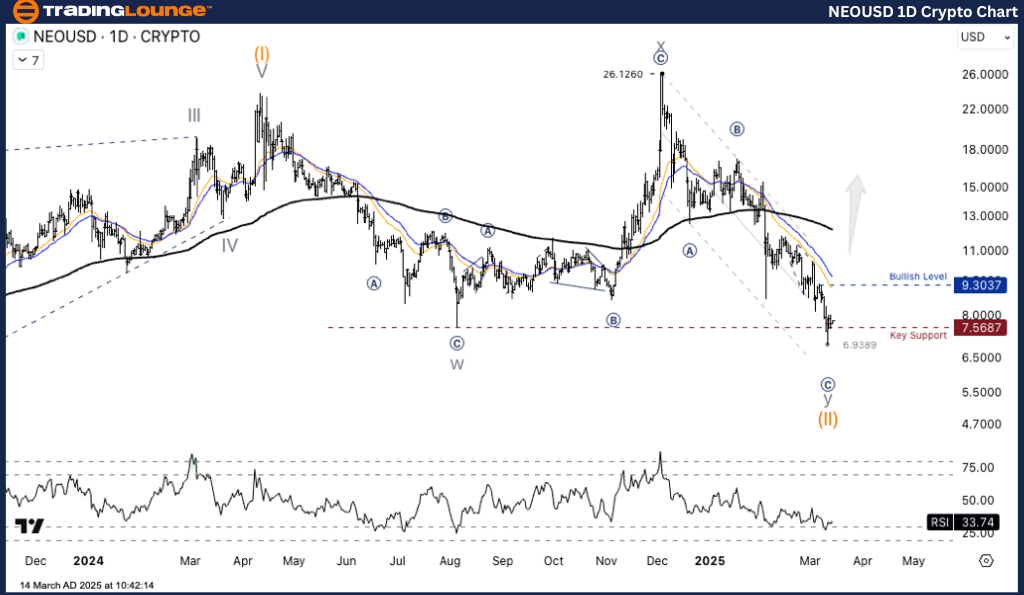
NEOUSD Elliott Wave Analysis – TradingLounge Daily Chart

NEO/USD (NEOUSD) Elliott Wave Technical Analysis

Function: Counter Trend

Mode: Corrective

Structure: Zigzag

Position: Wave ((C))

Next Higher Degree Direction: Wave Y

Wave Cancellation Invalid Level: N/A

Details: The ongoing correction follows a WXY pattern, reaching a completion zone around $6.938 USD.

NEO/USD Trading Strategy

NEO/USD experienced a strong rally to $26.12 at the end of last year before undergoing a sharp correction, forming a WXY Double Zigzag pattern. The price recently hit a low of $6.93, aligning with a critical support zone. Currently, NEOUSD is in wave (II) within the broader uptrend, suggesting a possible reversal soon.

A key support level at $7.56 is crucial for confirming a trend shift. If NEO maintains this level, a bullish reversal could emerge.

NEOUSD Trading Strategies

Long Strategy

✅ For Short-Term Traders (Swing Trade):

  • Monitor price action above $7.56 for stability.
  • Look for Bullish Divergence signals or a breakout above $9.30 resistance for confirmation.

Risk Management: If the price falls below $6.93, it signals that the correction is not yet over, increasing the possibility of further downside movement.

NEOUSD-1D-Crypto-Cha...


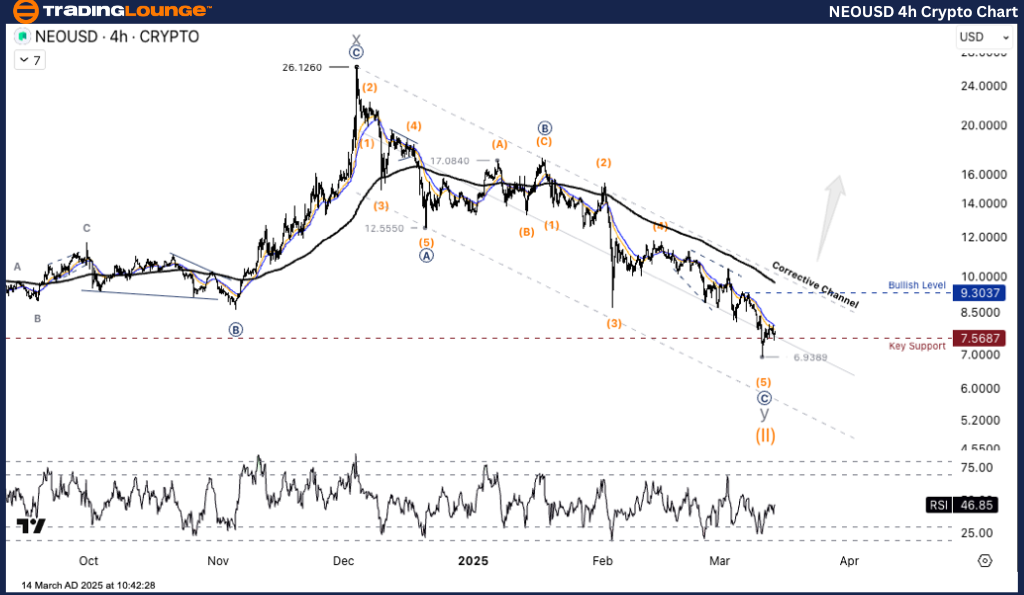
NEOUSD Elliott Wave Analysis – TradingLounge H4 Chart

NEO/USD (NEOUSD) Elliott Wave Technical Analysis

Function: Counter Trend

Mode: Corrective

Structure: Zigzag

Position: Wave ((C))

Next Higher Degree Direction: Wave Y

Wave Cancellation Invalid Level: N/A

Details: The price correction follows a WXY structure, completing around $6.938 USD.

NEO/USD Trading Strategy

After a significant rally to $26.12, NEO/USD has undergone a sharp correction, recently bottoming at $6.93—a crucial support zone. The corrective move, forming a WXY Double Zigzag, indicates that the downtrend may be nearing completion.

A key support level at $7.56 is pivotal for determining the next move. If NEO/USD holds above this level, a potential bullish reversal may be underway.

NEOUSD Trading Strategies

Long Strategy
✅ For Short-Term Traders (Swing Trade):

  • Observe price stability above $7.56 for potential reversal signs.
  • Watch for Bullish Divergence signals or a breakout above $9.30 resistance for confirmation.

Risk Management:
A drop below $6.93 may indicate further correction and downside risk.

Technical Analyst: Kittiampon Somboonsod

Source: Visit Tradinglounge.com and learn from the Experts. Join TradingLounge Here 

Previous: BTCUSD Elliott Wave Technical Analysis

VALUE Offer - Buy 1 Month & Get 3 Months!Click here

Access 7 Analysts Over 200 Markets Covered. Chat Room With Support

NEOUSD-4h-Crypto-Cha...

Related

EUR/USD Elliott Wave Analysis Reveals Bullish Impulse Pattern Suggesting Continued Uptrend in Forex Market

EUR/USD Elliott Wave Analysis Reveals Bullish Impulse Pattern Suggesting Continued Uptrend in Forex Market

The EUR/USD pair exhibits a bullish impulsive pattern according to Elliott Wave analysis, indicating...

Read More >
Walmart Inc. Stock Technical Forecast Using Elliott Wave: Bullish Wave (iii) Setup Validates Breakout Potential in WMT Price Chart

Walmart Inc. Stock Technical Forecast Using Elliott Wave: Bullish Wave (iii) Setup Validates Breakout Potential in WMT Price Chart

This analysis explores Walmart's (WMT) bullish outlook using Elliott Wave theory, identifying a ...

Read More >
CAC 40 Index Elliott Wave Technical Analysis: Key Insights for Trading and Investing in the French Stock Index

CAC 40 Index Elliott Wave Technical Analysis: Key Insights for Trading and Investing in the French Stock Index

This article dives into CAC 40 trading strategies, with an Elliott Wave analysis to guide investors ...

Read More >
Get Specific Price Targets: Westpac Banking Corporation Stock Analysis & Elliott Wave Technical Forecast

Get Specific Price Targets: Westpac Banking Corporation Stock Analysis & Elliott Wave Technical Forecast

Our comprehensive Elliott Wave analysis for WESTPAC BANKING CORPORATION (WBC) on the Australian Stoc...

Read More >
Stay Informed on Commodity Market: GX Uranium ETF (URA) Elliott Wave Technical Analysis

Stay Informed on Commodity Market: GX Uranium ETF (URA) Elliott Wave Technical Analysis

The Global X Uranium ETF (GX URA) offers investors a diversified portfolio of companies engaged in u...

Read More >

$1 for 2 Weeks

then $29 a month!

What a Special Offer!

Trade Recommendations

Unleash the power of deversified trading with our comprehensive portfolio, covering 250+ markets:

  • Stock Trades
  • Crypto Trades
  • Forex Trades
  • Commodity Trades
Elliott Wave Analysis

Gain a competitive edge with expert insights and AI-powered Elliott Wave charting into:

  • Global Indices
  • US Stocks & ASX Stocks
  • Forex & Crypto
  • Commodities
Top-Notch Trading Tools

Equip yourself with the tools of success:

  • Real-time Chat rooms
  • Elliott Wave Algorithm
  • Portfolio tools
  • TradingLevels
  • Screener
  • Trading Game
7 Elliott Wave Analysts

Stay ahead of the market with daily charts and insightful videos
Your secret to strategic trading!

JOIN HERE


Welcome to TradingLounge (ASIC A.R.No. 321187), specialists in trades, trading education and technical analysis, covering stocks, indices, commodities, forex and cryptocurrencies.

When you join TradingLounge you have access to everything we offer, including trade tools, educational content and a social platform to chat with like-minded investors.

Read more

@Copyright 2024 by tradinglounge.com

Contact Us

Australian no: 02 4787 6020

International no: +61 (2) 47876020

Pay with:

Find us on