Walmart Inc. (WMT) Stock – Trading Lounge Daily & 1H Charts
Walmart Inc. (WMT) Elliott Wave Analysis
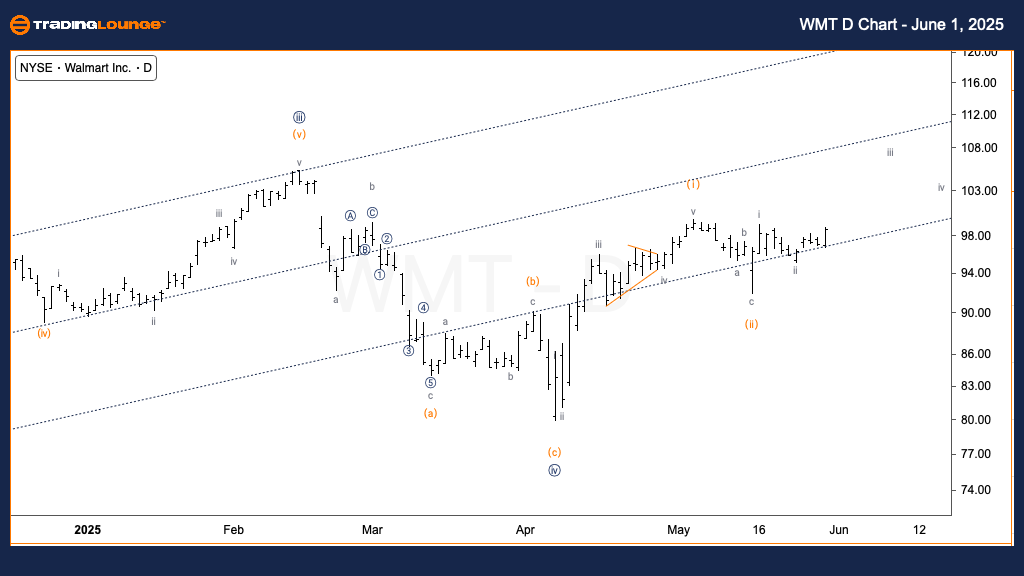
WMT Stock Daily Chart Analysis
WMT Elliott Wave Technical Overview
Function: Trend
Mode: Impulsive
Structure: Motive
Position: Wave (iii) of {v}
Direction: Upside continuation in wave (iii)
Details: A completed corrective pattern in wave {iv} hints at a fresh upward impulse. Wave (i) developed in five clear sub-waves, followed by a typical three-wave corrective move in wave (ii). For validation, a breakout above recent highs is needed to confirm wave (iii) strength.
Daily Analysis Summary
Walmart stock (WMT) shows a likely continuation of its bullish Elliott Wave pattern. The recent low likely completes wave {iv}, setting the stage for wave (iii) to advance. A consistent rise would affirm the upward trend, signaling the early stages of wave {v} in development. Traders should watch for confirmation of this bullish scenario through sustained price movement.
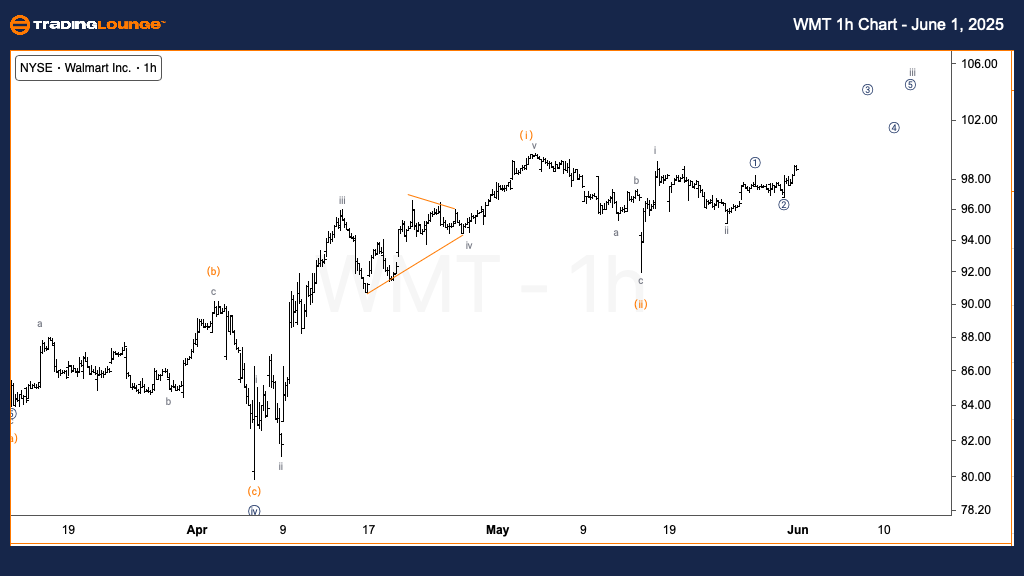
Walmart Inc. (WMT) – TradingLounge 1 Hour Chart Analysis
WMT Elliott Wave Technical Overview
Function: Trend
Mode: Impulsive
Structure: Motive
Position: Wave iii of (iii)
Direction: Upside movement in micro wave 3
Details: A nested 1-2, 1-2 formation on the chart supports a strong bullish impulse. A confirmed breakout above the $100 psychological level would validate this setup and suggest further gains in the short term.
1H Analysis Summary
Walmart's 1-hour Elliott Wave structure indicates rising momentum within wave iii of (iii). The nested wave count underlines bullish intensity. A decisive move beyond the $100 mark would serve as key confirmation, supporting the larger bullish structure evident in the daily chart.
Technical Analyst: Alessio Barretta
Source: Visit Tradinglounge.com and learn from the Experts. Join TradingLounge Here
Previous: VanEck Semiconductor ETF (SMH) Elliott Wave Technical Analysis
VALUE Offer - Buy 1 Month & Get 3 Months!Click here
Access 7 Analysts Over 200 Markets Covered. Chat Room With Support