TradingLounge Gold (XAUUSD) Commodity Analysis
Gold (XAUUSD) Elliott Wave Technical Analysis
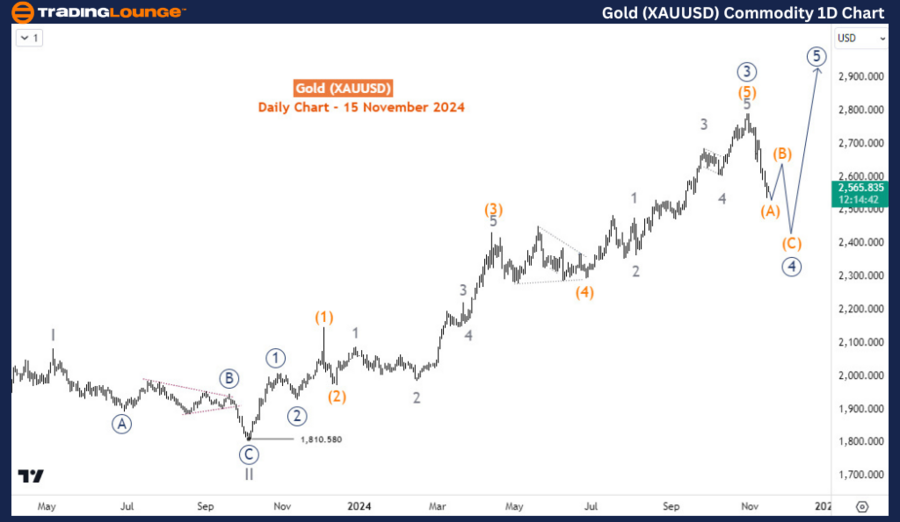
Gold is currently about 9% below its record high in late October. Despite the recent sell-off, the medium- and long-term outlook remains bullish. While a continuation of the bullish trend is anticipated, the current pullback from October is likely to deepen further before resuming the upward movement.
Gold (XAUUSD) Daily Chart Analysis
From a long-term Elliott Wave perspective, Gold seems to be correcting the bullish cycle that began in October 2023 when the price was around $1,810. After completing wave (IV) of the supercycle degree in September 2022, Gold rallied to form waves I and II of (V) in May 2023 and October 2023, respectively. Consequently, wave III of (V) initiated in October 2023 at $1,810. However, wave III does not appear to have completed yet. The current pullback might represent either wave ((4)) of III or wave (4) of ((3)) of III. The primary focus remains on identifying the structure unfolding from the late October peak.

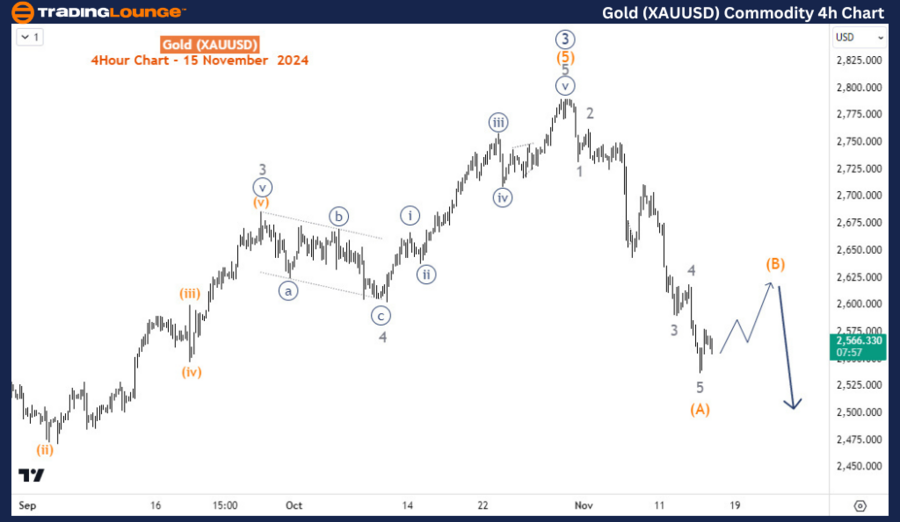
Gold (XAUUSD) H4 Chart Analysis
On the H4 chart, the price action indicates that wave (A) is in its final stages. A corrective wave (B) bounce is expected next, followed by a further decline in wave (C). Depending on the magnitude of wave (B), wave (C) could extend downward toward $2,400 or potentially lower.
Technical Analyst: Sanmi Adeagbo
Source: visit Tradinglounge.com and learn From the Experts Join TradingLounge Here
See Previous: Coffee Commodity Elliott Wave Technical Analysis
VALUE Offer - Buy 1 Month & Get 3 Months!Click here
Access 7 Analysts Over 200 Markets Covered. Chat Room With Support
