07Jan

XRP/ U.S. dollar(XRPUSD) Elliott Wave Analysis: Predicting Price Trends, Triangle Pattern Signals

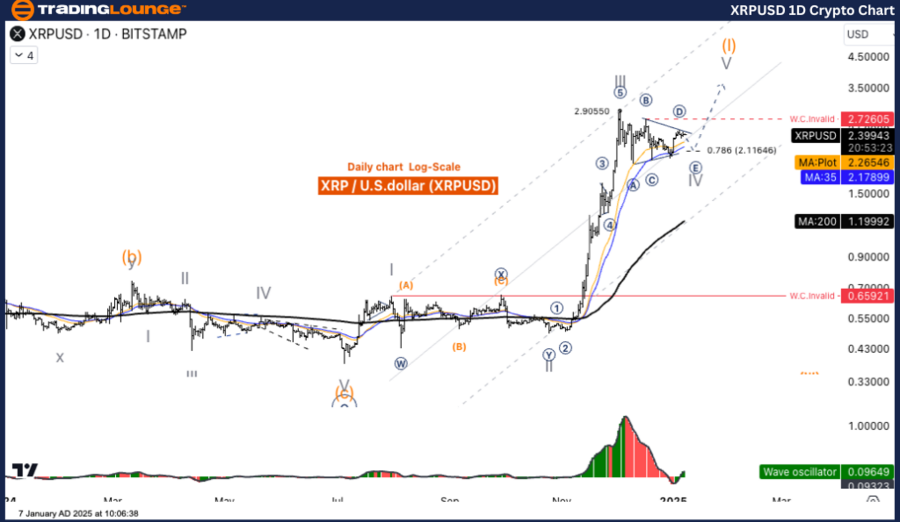
XRP/USD (XRPUSD) Elliott Wave Analysis TradingLounge Daily Chart

XRPUSD Elliott Wave Technical Analysis

Function: Follow Trend

Mode: Motive

Structure: Impulse

Position: Wave IV

Next Higher Degree Direction: Wave (I)

Wave Invalid Level: (Specify as needed)

Details:

The retracement of Wave IV is nearing completion, indicating a likely upward movement in Wave V.

XRP/USD (XRPUSD) Trading Strategy

The corrective structure of Wave IV follows a Triangle pattern. The price is in the final declining phase of Wave E, which will complete the Triangle pattern. Traders are advised to wait for Wave E to finalize before rejoining the anticipated uptrend.

XRP/USD (XRPUSD) Technical Indicators

  • Moving Average (MA200): The price remains above the MA200, confirming an uptrend.
  • Wave Oscillator: Displays bullish momentum, supporting an upward bias.

XRPUSD-1d-crypto-cha...


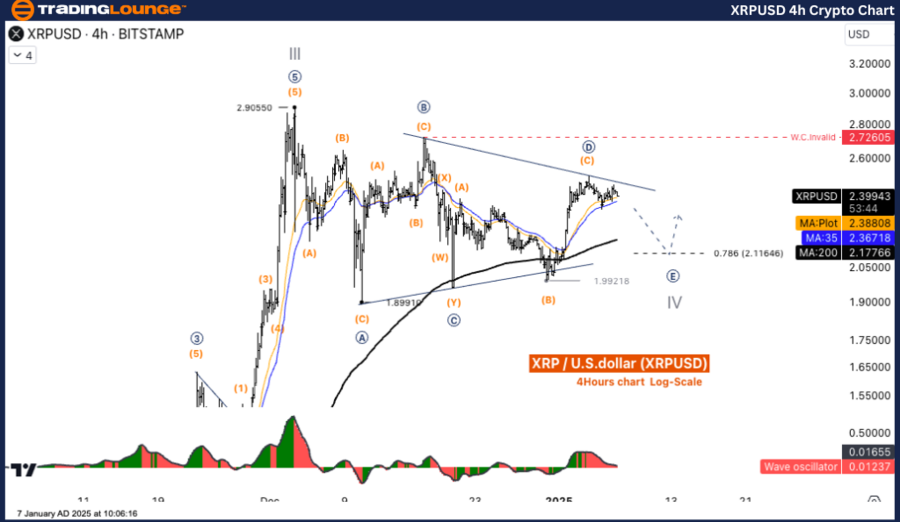
XRP/USD (XRPUSD) Elliott Wave Analysis TradingLounge 4-Hour Chart

XRPUSD Elliott Wave Technical Analysis

Function: Follow Trend

Mode: Motive

Structure: Impulse

Position: Wave IV

Next Higher Degree Direction: Wave (I)

Wave Invalid Level: (Specify as needed)

Details:

Wave IV is in a retracement phase, setting the stage for an upward move into Wave V.

XRP/USD (XRPUSD) Trading Strategy

Wave IV’s corrective Triangle pattern is nearly complete, with Wave E currently in its final phase. Traders should monitor the completion of Wave E for opportunities to enter the next bullish trend.

XRP/USD (XRPUSD) Technical Indicators

  • Moving Average (MA200): The price remains above the MA200, highlighting an ongoing uptrend.
  • Wave Oscillator: Indicates bullish momentum, signaling potential upward continuation.

Technical Analyst: Kittiampon Somboonsod

Source: visit Tradinglounge.com and learn From the Experts Join TradingLounge Here 

Previous: DOGEUSD Elliott Wave Technical Analysis

VALUE Offer - Buy 1 Month & Get 3 Months!Click here

Access 7 Analysts Over 200 Markets Covered. Chat Room With Support

XRPUSD-4h-crypto-cha...

Related

MicroStrategy Inc. (MSTR) Elliott Wave Forecast Shows Bullish Trend With Fibonacci Target

MicroStrategy Inc. (MSTR) Elliott Wave Forecast Shows Bullish Trend With Fibonacci Target

MicroStrategy (MSTR) is unfolding a bullish five-wave Elliott structure, nearing a major top before ...

Read More >
Mastercard (MA) Elliott Wave Analysis Reveals Bullish Trend Potential or Imminent Correction Based on Current Wave Count Structure

Mastercard (MA) Elliott Wave Analysis Reveals Bullish Trend Potential or Imminent Correction Based on Current Wave Count Structure

Analyze Mastercard’s (MA) price movement using Elliott Wave theory. The current chart suggests a bu...

Read More >
Costco Wholesale Corp.(COST:NASDAQ) Elliott Wave Technical Analysis 10 January 24

Costco Wholesale Corp.(COST:NASDAQ) Elliott Wave Technical Analysis 10 January 24

Costco Wholesale Corp.(COST: NASDAQ) Elliott Wave Technical Analysis Dated 10 January 24 with 4-Hour...

Read More >
VeChian Crypto Trading Strategy: Focusing on VeChain's Price Prediction and VETUSD Elliott Wave Technical Analysis

VeChian Crypto Trading Strategy: Focusing on VeChain's Price Prediction and VETUSD Elliott Wave Technical Analysis

This article provides a comprehensive VETUSD Elliott Wave analysis, focusing on VeChain's price ...

Read More >
Eaton Corp PLC Stocks Elliott Wave Technical Analysis: ETN Currently in an Impulsive Uptrend, Investors Can Gauge Upcoming Opportunities

Eaton Corp PLC Stocks Elliott Wave Technical Analysis: ETN Currently in an Impulsive Uptrend, Investors Can Gauge Upcoming Opportunities

This article provides a comprehensive Elliott Wave analysis of Eaton Corp PLC (ETN) using both daily...

Read More >
SBIN Elliott Wave Analysis: Daily Orange Wave 2 Correction & Weekly Navy Blue Wave 5 Impulse – SBI Stock Forecast & Strategy

SBIN Elliott Wave Analysis: Daily Orange Wave 2 Correction & Weekly Navy Blue Wave 5 Impulse – SBI Stock Forecast & Strategy

Elliott Wave analysis of SBI charts reveals a corrective Orange Wave 2 on the daily chart within Nav...

Read More >

$1 for 2 Weeks

then $29 a month!

What a Special Offer!

Trade Recommendations

Unleash the power of deversified trading with our comprehensive portfolio, covering 250+ markets:

  • Stock Trades
  • Crypto Trades
  • Forex Trades
  • Commodity Trades
Elliott Wave Analysis

Gain a competitive edge with expert insights and AI-powered Elliott Wave charting into:

  • Global Indices
  • US Stocks & ASX Stocks
  • Forex & Crypto
  • Commodities
Top-Notch Trading Tools

Equip yourself with the tools of success:

  • Real-time Chat rooms
  • Elliott Wave Algorithm
  • Portfolio tools
  • TradingLevels
  • Screener
  • Trading Game
7 Elliott Wave Analysts

Stay ahead of the market with daily charts and insightful videos
Your secret to strategic trading!

JOIN HERE


Welcome to TradingLounge (ASIC A.R.No. 321187), specialists in trades, trading education and technical analysis, covering stocks, indices, commodities, forex and cryptocurrencies.

When you join TradingLounge you have access to everything we offer, including trade tools, educational content and a social platform to chat with like-minded investors.

Read more

@Copyright 2024 by tradinglounge.com

Contact Us

Australian no: 02 4787 6020

International no: +61 (2) 47876020

Pay with:

Find us on