Welcome to Our Latest Elliott Wave Analysis for VanEck Semiconductor ETF (SMH) - May 30, 2024 This analysis offers a thorough examination of SMH's price movements using Elliott Wave Theory, aiding traders in identifying potential opportunities based on prevailing trends and market structure. We'll delve into insights from both daily and 4-hour charts to provide a holistic view of SMH's market behavior.

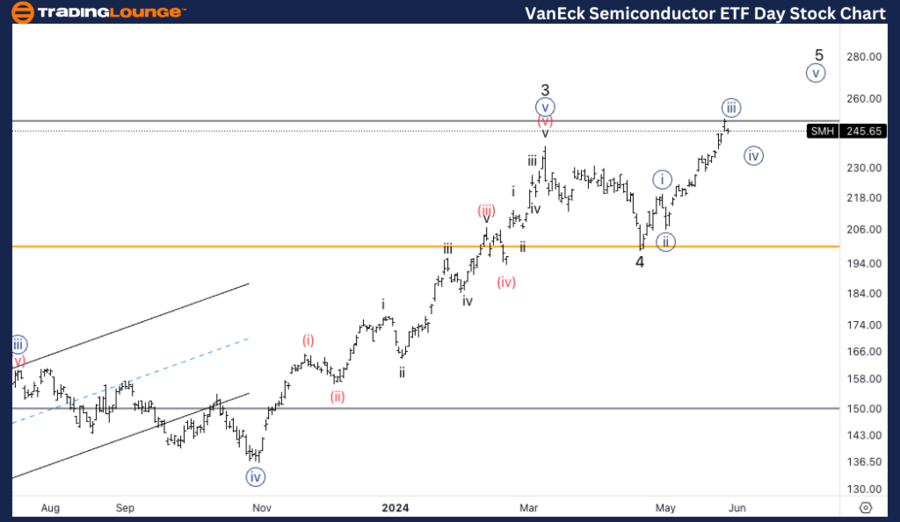
Trading Lounge SMH Elliott Wave Analysis - Daily Chart

VanEck Semiconductor ETF (SMH) Daily Chart Analysis

SMH Elliott Wave Technical Analysis

Function: Trend

Mode: Impulsive

Structure: Motive

Position: Minor 5

Direction: Upside in Minor 5

Details: We have reached the Medium Level at $250, anticipating a potential wave {iv} of 5 to move sideways.

SMH Elliott Wave Technical Analysis – Daily Chart

In our Elliott Wave analysis of the VanEck Semiconductor ETF (SMH) on May 30, 2024, we note an impulsive trend characterized by a motive structure. SMH is currently in Minor wave 5, suggesting an upside movement. After reaching the Medium Level at $250, we expect a potential wave {iv} of 5 to move sideways. Traders should watch this key level for consolidation signs before the trend possibly continues upward.

VanEck-Semiconductor...


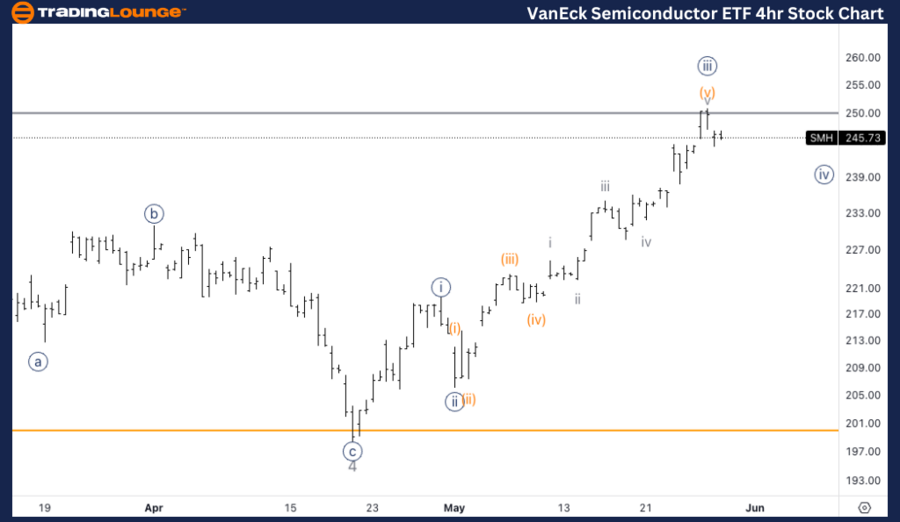
SMH Elliott Wave Analysis - Trading Lounge 4-Hour Chart

VanEck Semiconductor ETF (SMH) 4-Hour Chart Analysis

SMH Elliott Wave Technical Analysis

Function: Trend

Mode: Impulsive

Structure: Motive

Position: Minor 5

Direction: Correction in wave {iv}

Details: The subcounts of wave {iii} suggest a top in wave {iii} at $250. Expecting a sideways wave {iv} before continuing higher towards MG2.

SMH Elliott Wave Technical Analysis – 4-Hour Chart

On the 4-hour chart, SMH follows an impulsive trend within a motive structure, specifically in Minor wave 5. The subcounts of wave {iii} indicate a potential top at $250. We anticipate a sideways movement in wave {iv} before resuming the upward trend towards MG2. This corrective phase provides an opportunity to reassess positions and prepare for the next bullish move.

Technical Analyst: Alessio Barretta

Source: visit Tradinglounge.com and learn From the Experts Join TradingLounge Here 

See Previous:NextEra Energy Inc., (NEE) Stocks Elliott Wave Technical Analysis


Special Trial Offer - 0.76 Cents a Day for 3 Months! Click here

Access 7 Analysts Over 170 Markets Covered. Chat Room With Support

VanEck-Semiconductor...

Related

NVIDIA Corp Stock Analysis: Elliott Wave analysis of NVIDIA Corp (NVDA) Examining Market Structure

NVIDIA Corp Stock Analysis: Elliott Wave analysis of NVIDIA Corp (NVDA) Examining Market Structure

This article provides a thorough Elliott Wave analysis of NVIDIA Corp (NVDA), examining price moveme...

Read More >
New Zealand Dollar/U.S.Dollar(NZDUSD) Elliott Wave Technical Analysis 25 January 24

New Zealand Dollar/U.S.Dollar(NZDUSD) Elliott Wave Technical Analysis 25 January 24

The NZDUSD Elliott Wave Technical Analysis for the Day and 4-hour Chart on 25 January 24, provides a...

Read More >
Trading opportunities within the Currency pair: GBPJPY Elliott Wave Technical Analysis on daily and 4-hour charts

Trading opportunities within the Currency pair: GBPJPY Elliott Wave Technical Analysis on daily and 4-hour charts

Strategic insights into GBPJPY trading with Elliott Wave Analysis, focusing on counter-trend opportu...

Read More >
Gain valuable insights XRP Crypto Price News Today XRPUSD Elliott Wave Technical Analysis

Gain valuable insights XRP Crypto Price News Today XRPUSD Elliott Wave Technical Analysis

Gain valuable insights into XRPUSD's market dynamics with technical analysis, Elliott Wave predi...

Read More >
Today's Stock Market Indices: S&P 500, NASDAQ 100, DAX 40 & More - Elliott Wave Analysis Insights

Today's Stock Market Indices: S&P 500, NASDAQ 100, DAX 40 & More - Elliott Wave Analysis Insights

Today's stock market indices, including S&P 500, NASDAQ 100, DAX 40, and others, show a generall...

Read More >
 Learn Current Market Trends and Expert Insights: BRAMBLES LIMITED Stock Analysis & BXB Elliott Wave Technical Forecast

Learn Current Market Trends and Expert Insights: BRAMBLES LIMITED Stock Analysis & BXB Elliott Wave Technical Forecast

Explore our comprehensive Elliott Wave technical analysis of BRAMBLES LIMITED (BXB) on the ASX. Lear...

Read More >

Buy 1 Month

Get 3 Months!

Special Offer:

Trade Recommendations

Unleash the power of deversified trading with our comprehensive portfolio, covering:

  • Stock Trades
  • Crypto Trades
  • Forex Trades
  • Commodity Trades
Elliott Wave Analysis

Gain a competive edge with expert insights in to:

  • Global Indices
  • US Stocks & ASX Stocks
  • Forex & Crypto
  • Commodities
Top-Notch Trading Tools

Equip yourself with the tools of success:

  • Social Chat
  • Elliott Wave Algorithm
  • Screener
  • TradingLevels
  • Trading Game
7 Elliott Wave Analysts

Stay ahead of the market with daily charts and insightful videos
-Your secret to strategic trading!

JOIN HERE


Welcome to TradingLounge (ASIC A.R.No. 321187), specialists in trades, trading education and technical analysis, covering stocks, indices, commodities, forex and cryptocurrencies.

When you join TradingLounge you have access to everything we offer, including trade tools, educational content and a social platform to chat with like-minded investors.

Read more

@Copyright 2024 by tradinglounge.com

Contact Us

Australian no: 02 4787 6020

International no: +61 (2) 47876020

Pay with:

Find us on