Explore the latest insights from Elliott Wave Analysis on Bitcoin/USD (BTCUSD) as of February 27, 2024, provided by TradingLounge. Dive into the daily and 4-hour charts for a comprehensive understanding of the market trends and potential trading strategies.
BTCUSD Elliott Wave Analysis TradingLounge, 27 February 24,
BTCUSD Elliott Wave Technical Analysis
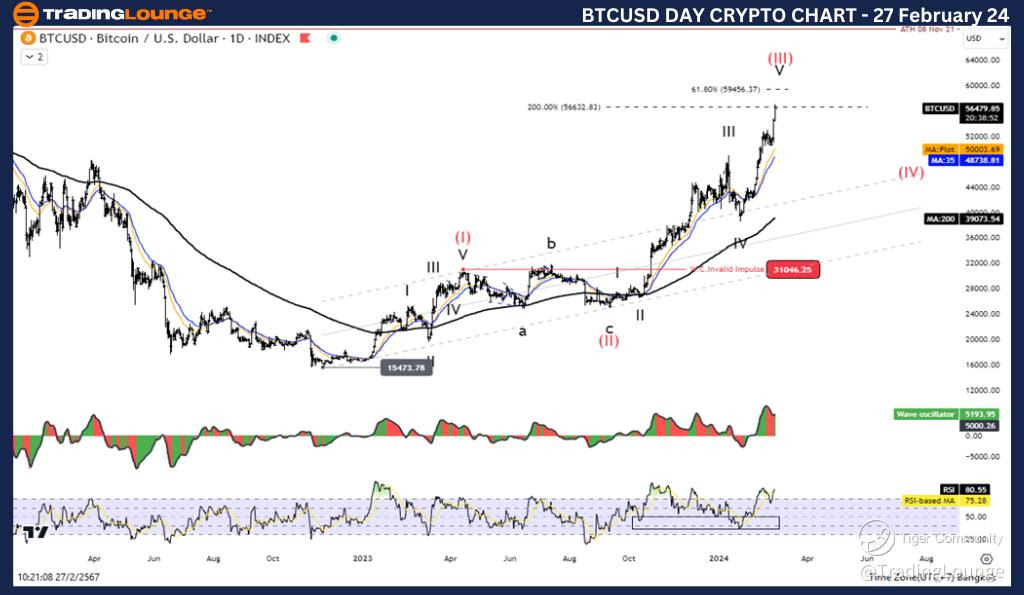
Bitcoin/ U.S. dollar(BTCUSD) Daily Chart Analysis
Function: Follow Trend
Mode: Motive
Structure: Impulse
Position: Wave V
Direction Next higher Degrees: Wave (III)
Wave Cancel invalid level: 31046.25
Details: The market is currently experiencing a five-wave increase within Wave (III). As we navigate through Wave V, a sub-wave of Wave (III), it is anticipated that the price may test the 59456 level before undergoing another corrective phase. While the overall trend remains upward, there are indications that we might be approaching the end of this bullish momentum.
Bitcoin/USD Trading Strategy: Considering the ongoing five-wave rally within Wave (III), particularly within Wave V, traders may anticipate a potential test of the 59456 level before a corrective move. However, it's crucial to remain vigilant as the market signals a potential end to the current trend.
Technical Indicators:
- Price Action: The price remains above the MA200, signaling an uptrend.
- Momentum: Wave oscillators indicate a bullish momentum, reinforcing the positive outlook for BTCUSD.
BTCUSD Elliott Wave Analysis TradingLounge, 27 February 24,
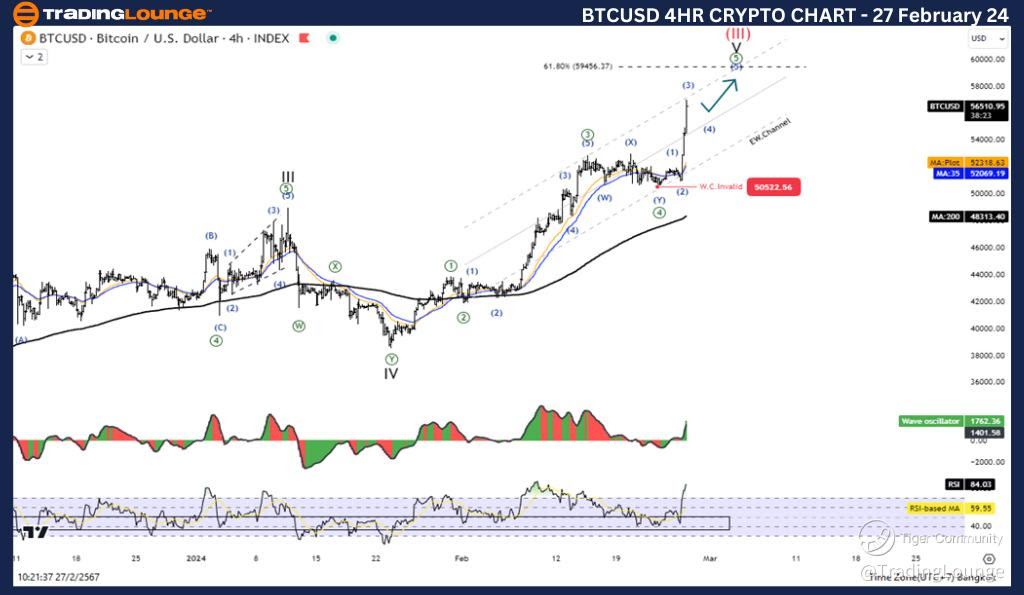
Bitcoin/ U.S. dollar(BTCUSD) 4-Hour Chart Analysis
BTCUSD Elliott Wave Technical Analysis
Function: Follow Trend
Mode: Motive
Structure: Impulse
Position: Wave V
Direction Next higher Degrees: Wave (III)
Wave Cancel invalid level: 31046.25
Details: Similar to the daily chart analysis, the 4-hour chart also illustrates a five-wave increase within Wave V, reflecting the ongoing bullish sentiment in the market.
Bitcoin/USD Trading Strategy: Traders should continue to monitor the five-wave rally within Wave (III), particularly within Wave V, for potential price movements. While the overall trend remains bullish, caution is advised as the market may be approaching a turning point.
Technical Indicators:
- Price Action: The price maintains its position above the MA200, indicating a sustained uptrend.
- Momentum: Wave oscillators continue to exhibit bullish momentum, supporting the positive outlook for BTCUSD.
In conclusion, the Elliott Wave Analysis suggests that Bitcoin/USD (BTCUSD) is currently experiencing a bullish phase, with Wave (III) showing signs of continuation. Traders should remain vigilant and adapt their strategies accordingly as the market dynamics evolve. Keep a close eye on key levels and technical indicators for timely decision-making in your trading endeavors.
TradingLounge Analyst: Kittiampon Somboonsod, CEWA
Source: visit Tradinglounge.com and learn From the Experts Join TradingLounge Here
See Previous: AAVE/ U.S. dollar(AAVEUSD)