12Jun

Daily & Weekly CAC 40 Elliott Wave Analysis: Corrective Counter‑Trend and Bullish Impulse Gray Wave 3, Watch Invalidation Level

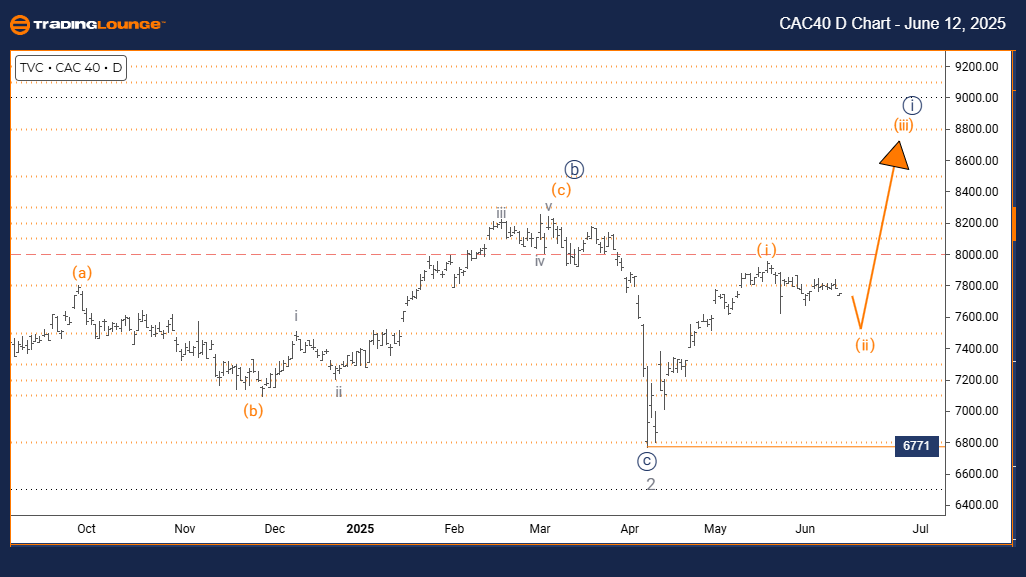
CAC 40 (France) Elliott Wave Analysis – Trading Lounge Day Chart

CAC 40 Index Day Chart Analysis

CAC 40 (France) Wave Technical Review

FUNCTION: Counter Trend

MODE: Corrective

STRUCTURE: Orange Wave 2

POSITION: Navy Blue Wave 1

DIRECTION NEXT HIGHER DEGREES: Orange Wave 3

DETAILS: Orange Wave 1 seems completed; Orange Wave 2 is developing.

Wave Cancel Invalidation Level: 6771

The CAC 40 Index daily Elliott Wave forecast identifies a counter-trend corrective structure. This analysis reflects that the index is currently forming Orange Wave 2, embedded within Navy Blue Wave 1, indicating a short-term retracement inside a larger bullish framework.

Orange Wave 1 appears finalized, with Orange Wave 2 progressing. Typically, this type of wave corrects part of the prior advance and leads into Orange Wave 3, which should align with the main trend. Traders should keep an eye on price behavior that signals the end of Orange Wave 2, which may lead to a bullish continuation.

Market conditions suggest a possibility of sideways or moderately bearish action during this corrective stage. The critical level for wave count invalidation is 6771. A drop below this threshold would nullify the current wave configuration, prompting a reevaluation of the Elliott structure.

CAC-40-index-day-cha...


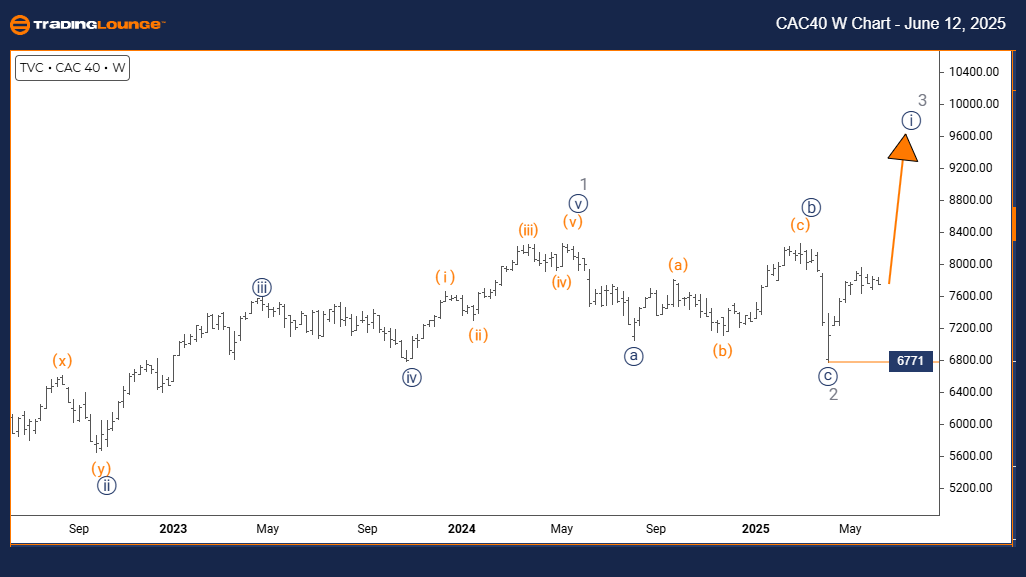
CAC 40 (France) Elliott Wave Analysis – Trading Lounge Weekly Chart

CAC 40 (France) Wave Technical Analysis

FUNCTION: Bullish Trend

MODE: Impulsive

STRUCTURE: Navy Blue Wave 1

POSITION: Gray Wave 3

DIRECTION NEXT LOWER DEGREES: Navy Blue Wave 2

DETAILS: Gray Wave 2 is complete; Navy Blue Wave 1 of Gray Wave 3 is unfolding.

Wave Cancel Invalidation Level: 6771

The weekly Elliott Wave analysis of the CAC 40 Index reveals a bullish momentum within an impulsive pattern. The index is currently tracing Navy Blue Wave 1 inside the larger structure of Gray Wave 3, signaling the early stages of a notable upward trend.

Gray Wave 2 appears completed, and the formation of Navy Blue Wave 1 indicates a new impulse phase. This wave count suggests the potential for further gains. The upcoming focus will be on Navy Blue Wave 2, which typically introduces a correction before further bullish action.

As long as the price remains above 6771, the bullish Elliott Wave outlook stays valid. Any move beneath this level would question the existing wave count and call for a revised analysis. Until then, the technical structure points to continued upside for the CAC 40 Index.

Technical Analyst: Malik Awais

Source: Visit Tradinglounge.com and learn from the Experts. Join TradingLounge Here 

Previous: NIFTY 50 INDEX Elliott Wave Technical Analysis

VALUE Offer - $1 for 2 Weeks then $29 a month!Click here

Access 7 Analysts Over 200 Markets Covered. Chat Room With Support

CAC-40-index-weekly-...

Related

Soybean Elliott Wave Technical Analysis: Price Trends, Technical Chart Insights, Market Forecast, and Long-Term Outlook for Traders

Soybean Elliott Wave Technical Analysis: Price Trends, Technical Chart Insights, Market Forecast, and Long-Term Outlook for Traders

Elliott Wave analysis of soybean prices, examining daily and H4 chart trends, corrective wave struct...

Read More >
Dogecoin (DOGEUSD) Elliott Wave Technical Analysis – Price Prediction, Trading Strategy, Support & Resistance Levels

Dogecoin (DOGEUSD) Elliott Wave Technical Analysis – Price Prediction, Trading Strategy, Support & Resistance Levels

Dogecoin (DOGEUSD) Elliott Wave analysis provides a detailed look at the current price trends, marke...

Read More >
U.S.Dollar /Canadian Dollar(USD/CAD) Elliott Wave Technical Analysis 26 January 24

U.S.Dollar /Canadian Dollar(USD/CAD) Elliott Wave Technical Analysis 26 January 24

USD/CAD Elliott Wave Analysis dated 26 January 24, delves into the technical analysis of the U.S. Do...

Read More >
TASI Index Elliott Wave Analysis – Saudi Stock Market Chart Insights To Help Traders Manage Risk and Optimize their Trading Strategies

TASI Index Elliott Wave Analysis – Saudi Stock Market Chart Insights To Help Traders Manage Risk and Optimize their Trading Strategies

This comprehensive analysis of the TASI Index provides insights into Elliott Wave structures on both...

Read More >
Elliott Wave Analysis Predicts CAR Group Limited Stock Rally, ASX: CAR Technical Forecast with Wave 5 Setup and Key Levels

Elliott Wave Analysis Predicts CAR Group Limited Stock Rally, ASX: CAR Technical Forecast with Wave 5 Setup and Key Levels

CAR Group Limited (ASX: CAR) technical overview provides an in-depth Elliott Wave analysis, covering...

Read More >

$1 for 2 Weeks

then $29 a month!

What a Special Offer!

Trade Recommendations

Unleash the power of deversified trading with our comprehensive portfolio, covering 250+ markets:

  • Stock Trades
  • Crypto Trades
  • Forex Trades
  • Commodity Trades
Elliott Wave Analysis

Gain a competitive edge with expert insights and AI-powered Elliott Wave charting into:

  • Global Indices
  • US Stocks & ASX Stocks
  • Forex & Crypto
  • Commodities
Top-Notch Trading Tools

Equip yourself with the tools of success:

  • Real-time Chat rooms
  • Elliott Wave Algorithm
  • Portfolio tools
  • TradingLevels
  • Screener
  • Trading Game
7 Elliott Wave Analysts

Stay ahead of the market with daily charts and insightful videos
Your secret to strategic trading!

JOIN HERE


Welcome to TradingLounge (ASIC A.R.No. 321187), specialists in trades, trading education and technical analysis, covering stocks, indices, commodities, forex and cryptocurrencies.

When you join TradingLounge you have access to everything we offer, including trade tools, educational content and a social platform to chat with like-minded investors.

Read more

@Copyright 2024 by tradinglounge.com

Contact Us

Australian no: 02 4787 6020

International no: +61 (2) 47876020

Pay with:

Find us on