NIFTY 50 INDEX Elliott Wave Analysis – Trading Lounge Day Chart
NIFTY 50 INDEX Day Chart Analysis
NIFTY 50 INDEX Elliott Wave Technical Review
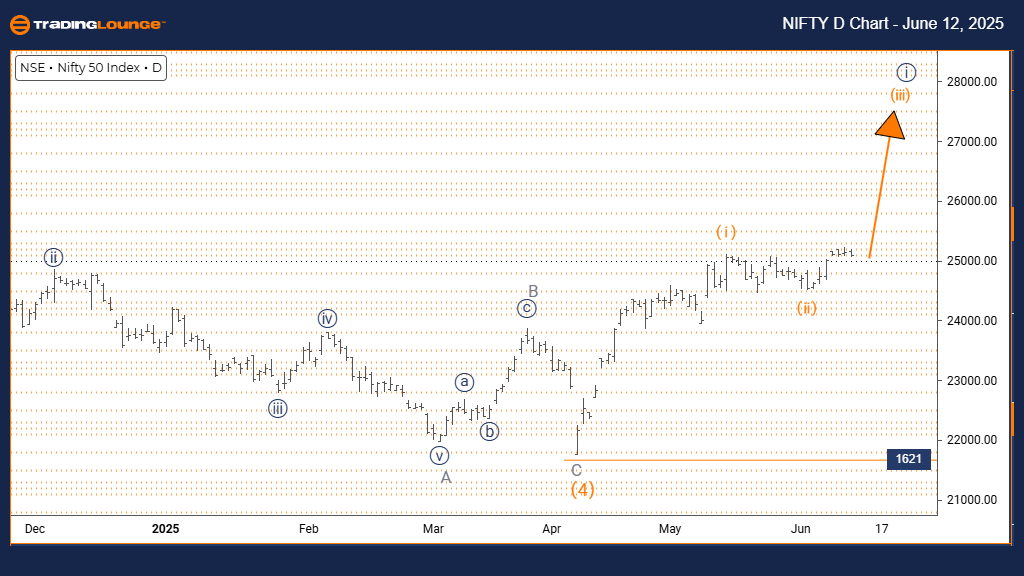
FUNCTION: Bullish Trend
MODE: Impulsive
STRUCTURE: Orange Wave 3
POSITION: Navy Blue Wave 1
DIRECTION NEXT LOWER DEGREES: Orange Wave 4
DETAILS: Orange Wave 2 appears complete; Orange Wave 3 is actively progressing.
Wave Cancel Invalidation Level: 1621
The NIFTY 50 Elliott Wave analysis on the daily chart indicates an ongoing bullish trend. Price movement shows a clear impulsive mode, confirming strong upward momentum. The current wave configuration aligns with Orange Wave 3, which forms part of a larger bullish sequence identified as Navy Blue Wave 1. This suggests that the index is in a key advancing phase within a sustained uptrend.
The prior corrective phase, Orange Wave 2, appears to have concluded, leading into the active progression of Orange Wave 3—often the strongest and most dynamic wave in an Elliott Wave cycle. The next projected movement at a lower degree is Orange Wave 4, expected as a standard corrective pullback following Wave 3’s completion.
One crucial support to monitor is the wave invalidation level at 1621. A break below this threshold would nullify the current Elliott structure, necessitating a revised outlook. Until then, technical signals point to continued bullish strength in the NIFTY 50 INDEX.
With Orange Wave 3 underway and Wave 2 completed, the impulsive structure supports a scenario of extended price appreciation. The market setup reflects positive momentum, with strong investor engagement driving further upside potential.
NIFTY 50 INDEX Elliott Wave Analysis – Trading Lounge Weekly Chart
NIFTY 50 INDEX Elliott Wave Technical Review
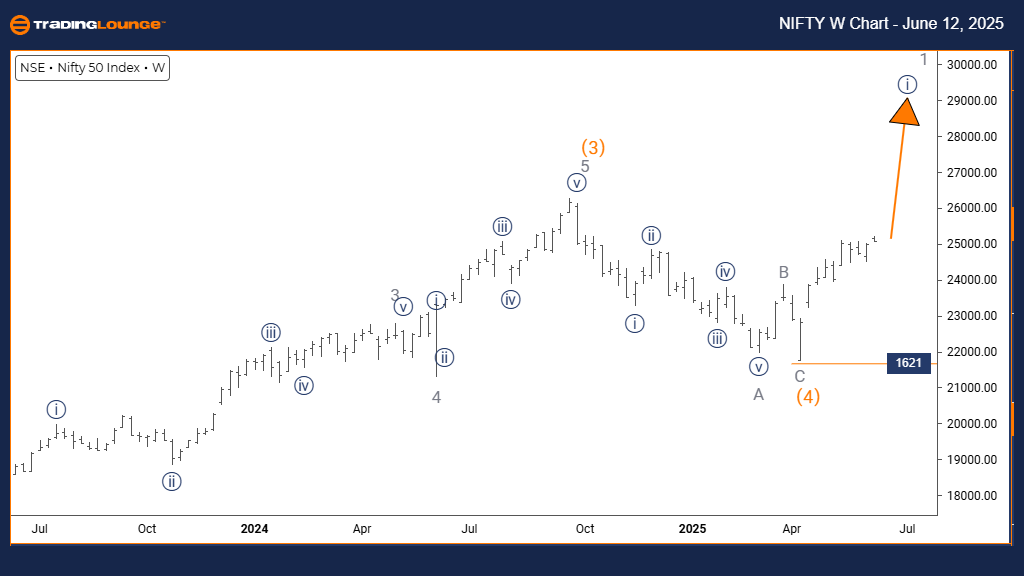
FUNCTION: Bullish Trend
MODE: Impulsive
STRUCTURE: Navy Blue Wave 1
POSITION: Gray Wave 1
DIRECTION NEXT LOWER DEGREES: Navy Blue Wave 2
DETAILS: Orange Wave 4 likely complete; Navy Blue Wave 1 of Gray Wave 1 is in progress.
Wave Cancel Invalidation Level: 1621
The weekly Elliott Wave analysis for NIFTY 50 INDEX reaffirms the bullish outlook. Price action follows an impulsive path, showcasing strong upward movement. The current wave label, Navy Blue Wave 1, is part of a larger formation termed Gray Wave 1. This implies the index is entering the early stages of a prolonged bullish cycle.
The analysis indicates that Orange Wave 4 has completed, transitioning into Navy Blue Wave 1, forming the beginning leg of Gray Wave 1. This wave pattern usually signals the onset of a new bullish sequence. The next anticipated phase is Navy Blue Wave 2, which would function as a corrective move before the uptrend continues.
Key support lies at the wave invalidation point of 1621. A decline below this level would call for a reassessment of the bullish scenario. Until that occurs, chart patterns and momentum indicators favor a continuation of the uptrend.
With Orange Wave 4 behind us and Navy Blue Wave 1 in motion, this structure provides strong evidence for ongoing price gains. The broader wave configuration supports a medium-term bullish market forecast, aligning with current momentum signals.
Technical Analyst: Malik Awais
Source: Visit Tradinglounge.com and learn from the Experts. Join TradingLounge Here
Previous: S&P BSE SENSEX NEXT 50 Elliott Wave Technical Analysis
VALUE Offer - $1 for 2 Weeks then $29 a month!Click here
Access 7 Analysts Over 200 Markets Covered. Chat Room With Support