11Jun

S&P BSE SENSEX NEXT 50 Elliott Wave Analysis: Impulsive Wave Forecast for Indian Stock Market with Key Levels

S&P BSE SENSEX NEXT 50 Elliott Wave Analysis – TradingLounge Day Chart

S&P BSE SENSEX NEXT 50 Wave Technical Outlook

FUNCTION: Bullish Momentum

MODE: Impulsive Phase

STRUCTURE: Orange Wave 3 in Motion

POSITION: Advancing Within Navy Blue Wave 3

HIGHER DEGREE DIRECTION: Orange Wave 3 Initiated

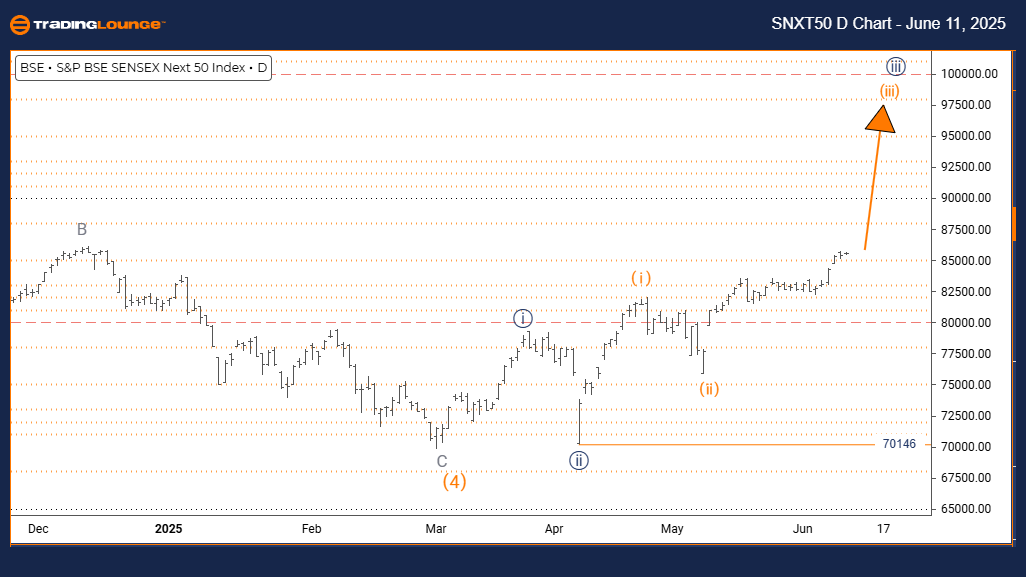
OBSERVATIONS: Orange Wave 2 Completion Confirmed, Orange Wave 3 Commences

INVALIDATION LEVEL: 70146

The daily Elliott Wave analysis for S&P BSE SENSEX NEXT 50 indicates a strong bullish trend backed by impulsive price behavior. The chart shows a breakout into Orange Wave 3, forming part of a larger bullish sequence within Navy Blue Wave 3. This reflects a sustained uptrend supported by market momentum.

Orange Wave 2 has completed its corrective phase, signaling the beginning of Orange Wave 3, often characterized by fast, extended gains. This wave generally leads the strongest market rallies within an impulsive cycle.

The key wave invalidation level is 70146. A move below this would nullify the existing Elliott Wave count and call for reevaluation. As long as price holds above this critical threshold, the bullish scenario stays intact, pointing to continued upward potential in S&P BSE SENSEX NEXT 50.

SENSEX-d-index-chart...


S&P BSE SENSEX NEXT 50 Elliott Wave Analysis – TradingLounge Weekly Chart

S&P BSE SENSEX NEXT 50 Wave Technical Outlook

FUNCTION: Bullish Momentum

MODE: Impulsive Phase

STRUCTURE: Navy Blue Wave 3 Formation

POSITION: Active Navy Blue Wave 3

HIGHER DEGREE DIRECTION: Navy Blue Wave 3 Underway

OBSERVATIONS: Completion of Navy Blue Wave 2, New Impulsive Wave in Progress

INVALIDATION LEVEL: 70146

The weekly Elliott Wave outlook for S&P BSE SENSEX NEXT 50 supports a bullish trajectory, with Navy Blue Wave 3 now active. This phase is commonly the most forceful within an Elliott structure, often suggesting strong continuation of gains.

Following the confirmed end of Navy Blue Wave 2, the market has entered Wave 3, generally associated with extended upward price action. Current developments align with this expectation.

Traders should watch the 70146 wave cancellation level. Falling below it would invalidate the wave count, necessitating a revised analysis. As long as prices stay above, the current wave projection remains valid, forecasting robust upward momentum in the index.

Technical Analyst: Malik Awais

Source: Visit Tradinglounge.com and learn from the Experts. Join TradingLounge Here 

Previous: Hang Seng Index Elliott Wave Technical Analysis

VALUE Offer - Buy 1 Month & Get 3 Months!Click here

Access 7 Analysts Over 200 Markets Covered. Chat Room With Support

SENSEX-w-index-chart...

Related

Gain valuable insights into the current Forex market: British Pound/U.S. Dollar GBPUSD Elliott Wave Technical Analysis

Gain valuable insights into the current Forex market: British Pound/U.S. Dollar GBPUSD Elliott Wave Technical Analysis

This article provides an in-depth GBPUSD Elliott Wave Analysis, focusing on day and 4-hour charts. D...

Read More >
Pepsico Inc.(PEP:NASDAQ) Elliott Wave Technical Analysis 6 November 23

Pepsico Inc.(PEP:NASDAQ) Elliott Wave Technical Analysis 6 November 23

Pepsico Inc.(PEP:NASDAQ) Elliott Wave Technical Analysis on 6 November, with 1-hour Chart and 4-hour...

Read More >
Abbie Inc US Stock Set for Drop: ABBV Elliott Wave Predicts Sharp ZigZag Correction Toward $165 with Prime Trade Opportunities

Abbie Inc US Stock Set for Drop: ABBV Elliott Wave Predicts Sharp ZigZag Correction Toward $165 with Prime Trade Opportunities

ABBV stock is forming a ZigZag corrective pattern in Elliott Wave structure, signaling a strong bear...

Read More >
Deep Understanding of Ethereum Crypto Price News Today Elliott Wave Technical Analysis

Deep Understanding of Ethereum Crypto Price News Today Elliott Wave Technical Analysis

Gain a deep understanding of Ethereum's price movements through Elliott Wave Analysis. This comp...

Read More >
Index Trading With Detailed Bovespa Index Elliott Wave Technical Analysis and Daily and Weekly Chart Forcast

Index Trading With Detailed Bovespa Index Elliott Wave Technical Analysis and Daily and Weekly Chart Forcast

Explore our detailed Bovespa Index trading insights, including Elliott Wave analysis, market trends,...

Read More >
WiseTech Global Limited Stock Analysis: WTC Elliott Wave Technical analysis & ASX Market Trading Strategy

WiseTech Global Limited Stock Analysis: WTC Elliott Wave Technical analysis & ASX Market Trading Strategy

"Explore in-depth Elliott Wave analysis and technical insights for WiseTech Global Limited (WTC...

Read More >

$1 for 2 Weeks

then $29 a month!

What a Special Offer!

Trade Recommendations

Unleash the power of deversified trading with our comprehensive portfolio, covering 250+ markets:

  • Stock Trades
  • Crypto Trades
  • Forex Trades
  • Commodity Trades
Elliott Wave Analysis

Gain a competitive edge with expert insights and AI-powered Elliott Wave charting into:

  • Global Indices
  • US Stocks & ASX Stocks
  • Forex & Crypto
  • Commodities
Top-Notch Trading Tools

Equip yourself with the tools of success:

  • Real-time Chat rooms
  • Elliott Wave Algorithm
  • Portfolio tools
  • TradingLevels
  • Screener
  • Trading Game
7 Elliott Wave Analysts

Stay ahead of the market with daily charts and insightful videos
Your secret to strategic trading!

JOIN HERE


Welcome to TradingLounge (ASIC A.R.No. 321187), specialists in trades, trading education and technical analysis, covering stocks, indices, commodities, forex and cryptocurrencies.

When you join TradingLounge you have access to everything we offer, including trade tools, educational content and a social platform to chat with like-minded investors.

Read more

@Copyright 2024 by tradinglounge.com

Contact Us

Australian no: 02 4787 6020

International no: +61 (2) 47876020

Pay with:

Find us on