30Jan

WiseTech Global (ASX: WTC) Elliott Wave Analysis: Bullish Wave 5 Breakout & Stock Forecast Indicating an Uptrend in Share Price

ASX: WISETECH GLOBAL LIMITED (WTC) Elliott Wave Technical Analysis

Overview

Welcome to today’s Elliott Wave analysis of WISETECH GLOBAL LIMITED (ASX: WTC). Our assessment highlights upside potential in WTC shares, following the completion of a Triangle corrective wave pattern at Wave 4, signaling a potential Wave 5 rally.


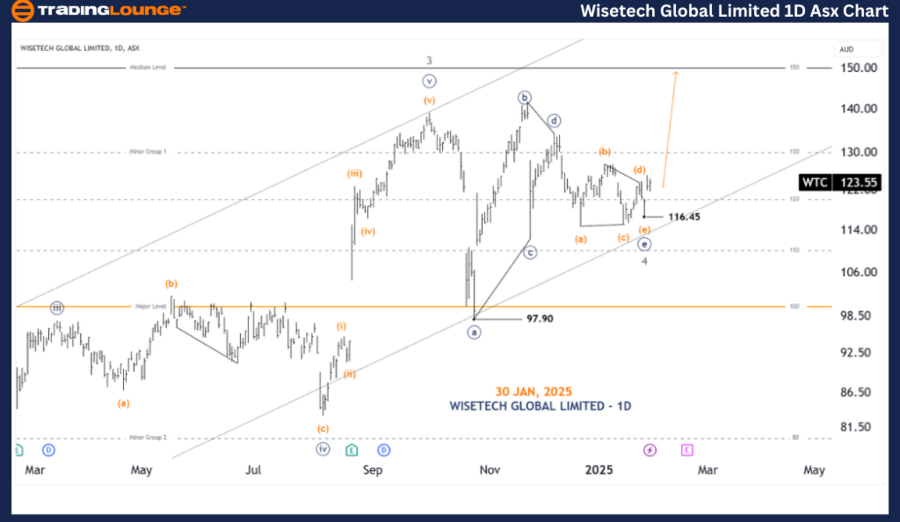
ASX: WISETECH GLOBAL LIMITED (WTC) 1D Chart Analysis (Semilog Scale)

Function: Major Trend (Minor Degree, Grey)

Mode: Motive

Structure: Impulse

Position: Wave 5 (Grey) of Wave (3) (Orange) of Wave ((1)) (Navy)

Key Observations

Wave 4 (Grey) appears to have completed a Triangle Pattern at the 116.45 low.
Wave 5 (Grey) is starting a bullish move higher.
Invalidation Level: 97.90 (if price drops below this level, the count is invalid).

Wisetech-Global-Limi...


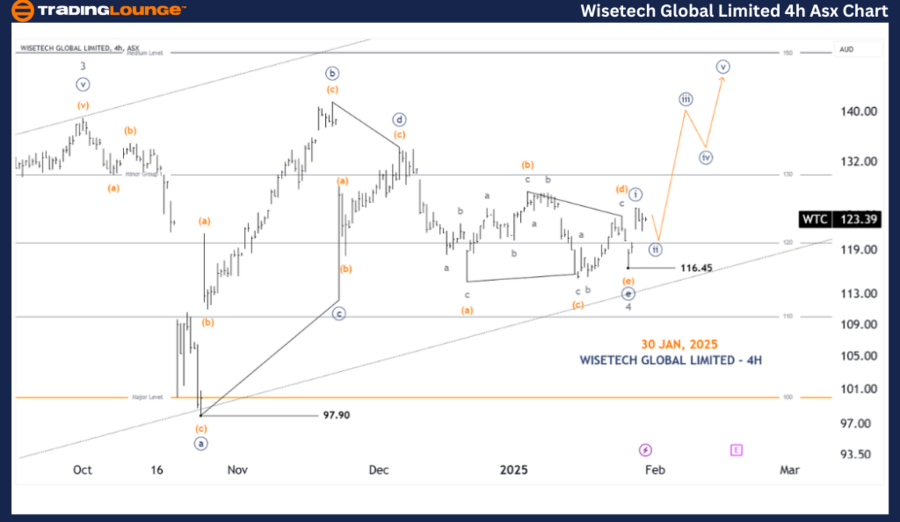
ASX: WISETECH GLOBAL LIMITED (WTC) 4H Chart Analysis

Function: Major Trend (Minute Degree, Navy)

Mode: Motive

Structure: Impulse

Position: Wave ((ii)) (Navy) of Wave 5 (Grey)

Key Observations

✔ A Triangle within a Triangle has formed and is close to completion.
✔ The pattern includes "9 waves", progressively narrowing—a strong Elliott Wave signal.
Wave 5 (Grey) is expected to break higher, with an initial price target of AUD 150.00.
Invalidation Level: 116.45 (a break below this level could alter the wave count).

Technical Analyst: Hua (Shane) Cuong, CEWA-M (Master’s Designation).

Source: visit Tradinglounge.com and learn From the Experts Join TradingLounge Here 

See Previous: WESTPAC BANKING CORPORATION (WBC) Elliott Wave Technical Analysis

VALUE Offer - Buy 1 Month & Get 3 Months!Click here

Access 7 Analysts Over 200 Markets Covered. Chat Room With Support

Wisetech-Global-Limi...


Conclusion

Our Elliott Wave analysis of WISETECH GLOBAL LIMITED (ASX: WTC) provides traders with valuable trend insights and key technical levels. The defined price points serve as confirmation or invalidation signals, improving confidence in the forecast.

By integrating technical patterns, trend analysis, and Elliott Wave principles, we deliver a strategic market outlook to help traders make informed decisions.

Related

Meta Platforms Inc. Stocks Elliott Wave Technical Analysis - Charts show an ongoing Bullish Trend Highlighting key Resistance Levels

Meta Platforms Inc. Stocks Elliott Wave Technical Analysis - Charts show an ongoing Bullish Trend Highlighting key Resistance Levels

This analysis of Meta Platforms (META) provides a detailed Elliott Wave forecast, highlighting key r...

Read More >
The Walt Disney Company (DIS) Stock - Elliottwave Technical Analysis

The Walt Disney Company (DIS) Stock - Elliottwave Technical Analysis

This comprehensive analysis provides an expert overview of The Walt Disney Company (DIS) stock, util...

Read More >
Euro/British Pound(EURGBP) 4 Hour Chart EURGBP Elliott Wave Technical Analysis 13 October 23

Euro/British Pound(EURGBP) 4 Hour Chart EURGBP Elliott Wave Technical Analysis 13 October 23

The EUR/GBP Elliott Wave Analysis for 13 October 23, serves as a valuable guide for traders and inve...

Read More >
Silver XAGUSD Commodity Elliott Wave Analysis: Forecasting Price Movements and Trading Opportunities in 2024

Silver XAGUSD Commodity Elliott Wave Analysis: Forecasting Price Movements and Trading Opportunities in 2024

Elliott Wave analysis of Silver, focusing on its market trends starting from early 2024. We discuss ...

Read More >
KOSPI Composite Index Elliott Wave Analysis: Detailed Daily and Weekly Insights into Bullish Trends, Market Predictions

KOSPI Composite Index Elliott Wave Analysis: Detailed Daily and Weekly Insights into Bullish Trends, Market Predictions

KOSPI Composite Index Elliott Wave Analysis, highlighting bullish trends on daily and weekly charts....

Read More >
INFOSYS INFY Elliott Wave Analysis: Bearish Trend, Impulsive Structure, and Trading Strategy for Daily & Weekly Charts

INFOSYS INFY Elliott Wave Analysis: Bearish Trend, Impulsive Structure, and Trading Strategy for Daily & Weekly Charts

Infosys uses Elliott Wave theory to analyze the current market structure on both daily and weekly ch...

Read More >

Buy 1 Month

Get 3 Months!

Special Offer:

Trade Recommendations

Unleash the power of deversified trading with our comprehensive portfolio, covering:

  • Stock Trades
  • Crypto Trades
  • Forex Trades
  • Commodity Trades
Elliott Wave Analysis

Gain a competive edge with expert insights in to:

  • Global Indices
  • US Stocks & ASX Stocks
  • Forex & Crypto
  • Commodities
Top-Notch Trading Tools

Equip yourself with the tools of success:

  • Social Chat
  • Elliott Wave Algorithm
  • Screener
  • TradingLevels
  • Trading Game
7 Elliott Wave Analysts

Stay ahead of the market with daily charts and insightful videos
-Your secret to strategic trading!

JOIN HERE


Welcome to TradingLounge (ASIC A.R.No. 321187), specialists in trades, trading education and technical analysis, covering stocks, indices, commodities, forex and cryptocurrencies.

When you join TradingLounge you have access to everything we offer, including trade tools, educational content and a social platform to chat with like-minded investors.

Read more

@Copyright 2024 by tradinglounge.com

Contact Us

Australian no: 02 4787 6020

International no: +61 (2) 47876020

Pay with:

Find us on